Figures & data
Figure 1. Upper respiratory tract geometry with key anatomical features labelled with locations and cross-sectional area of axial slices A-A to F-F
indicated.
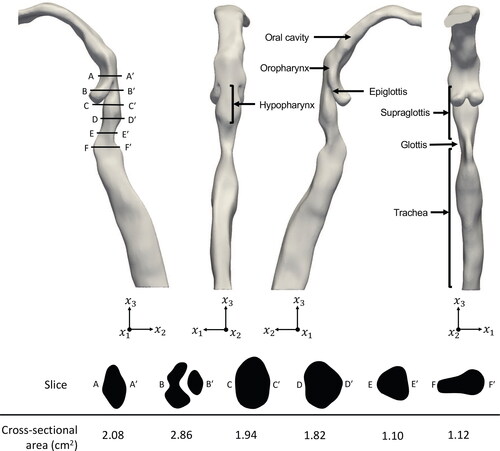
Figure 2. Location of the 11 regions of interest in the hypopharyngeal and supraglottic wall.
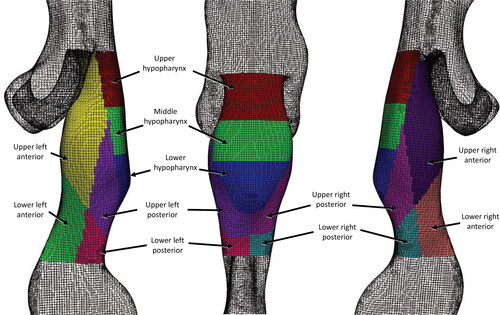
Table 1. Summary of meshes and results of convergence test. Average pressures of Slices 1 and 2 are given and the percentage difference is measured with respect to Mesh D.
Figure 3. Comparison of the results of the k-ω RANS model with laboratory experiments of Eggels et al. (Citation1994) and Den Toonder and Nieuwstadt (Citation1997) for velocity profile in a circular pipe.
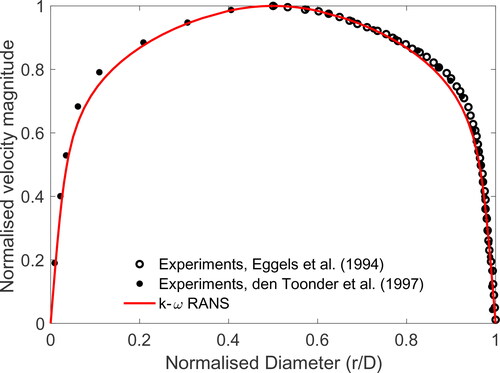
Figure 4. Comparison of the results of the k-ω RANS model with laboratory experiments of (Heenan et al. Citation2003) for pressure drop between the inlet and outlet of URT at different flow rates.
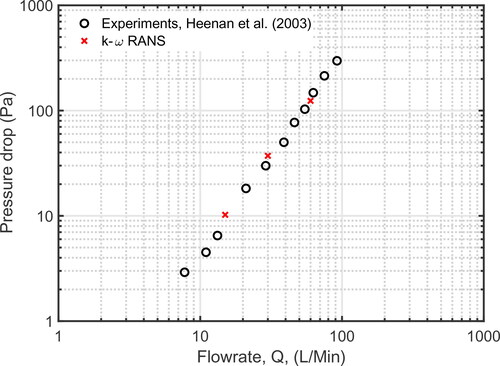
Figure 5. Comparison of the k-ω RANS model results with Xi et al. (Citation2018): (a) experimental measurements for pressure drop along the URT and (b) computational results for the velocity profile at the mid-point of the glottis at Q = 15 L/min.
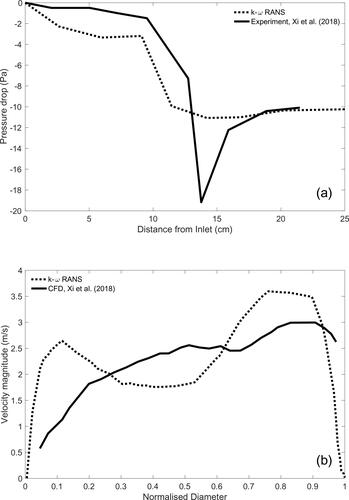
Figure 7. Mid-sagittal instantaneous velocity contours and axial cross-sections through the supraglottis with secondary velocity streamlines at (a) Q = 60 L/min and (b) Q = 240 L/min.
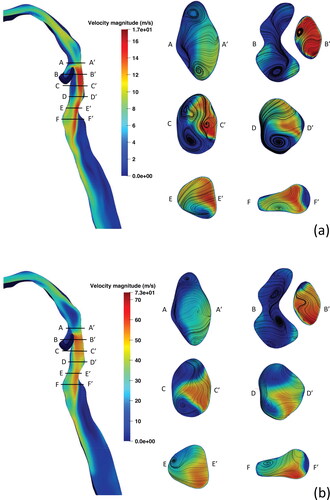
Figure 8. Mid-sagittal pressure field contours and axial cross-sections through the supraglottis with secondary streamlines at (a) Q = 60 L/min and (b) Q = 240 L/min.
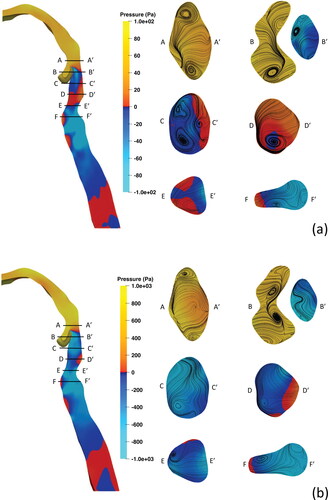
Figure 9. Pressure distribution on the URT wall for each flowrate presented from three views with left, middle, and right images being the left lateral, posterior, and right lateral views, respectively. (a) 30 L/min, (b) 60 L/min, (c) 120 L/min, (d) 180 L/min, and (e) 240 L/min.
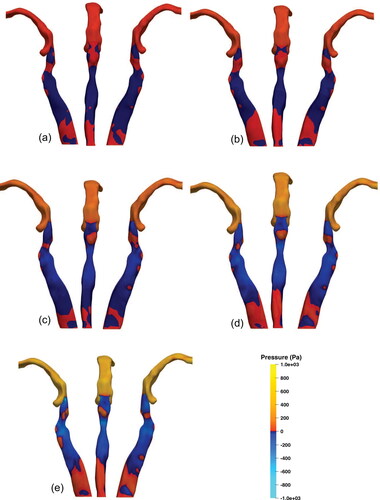
Figure 10. Comparison of regions of interest. (a) Pressure forces acting on regions of interest in the original URT geometry and (b) normalised force comparison on regions of interest with different epiglottic angles. The forces are normalised with respect to the values of the lower hypopharyngeal (LH) region at each configuration. LH, lower hypopharynx; MH, middle hypopharynx; UH, upper hypopharynx; ULA, upper left anterior; URA, upper right anterior; ULP, upper left posterior; URP, upper right posterior; LLA, lower left anterior; LRA, lower right anterior; LLP. lower left posterior; lower right posterior; see for the relative positions.
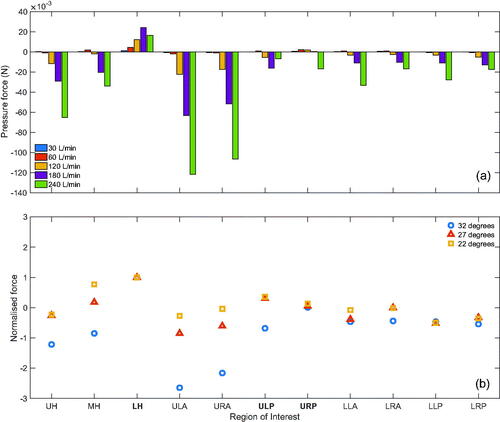
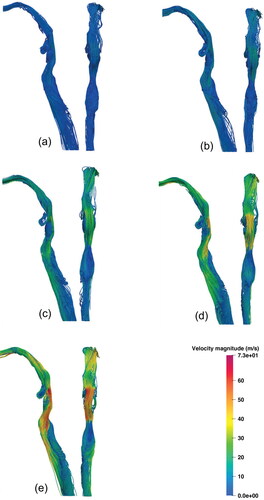
Figure 6. Lateral (left) and posterior (right) views of URT streamlines coloured by velocity magnitude for each inspiratory flow rate. (a) 30 L/min, (b) 60 L/min, (c) 120 L/min, (d) 180 L/min, and (e) 240 L/min.