Figures & data
Table 1. Summary and definition of the utilized kinetic measures. Order refers to the order of the tensorial quantity.
Table 2. Non-dimensionalised reference parameters for the unit cube.
Figure 1. Unit cube clamped at its bottom surface, allowing for displacements at all other nodes only in the x-direction, and the corresponding external load F over time.
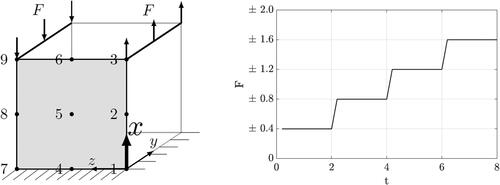
Figure 2. Evolution of the density within the unit cube by performing the variation of the length scale parameter.
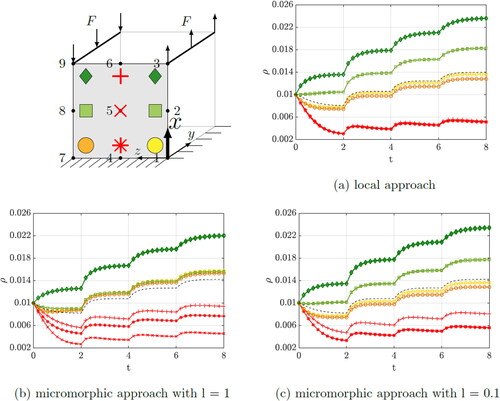
Figure 3. Evolution of the displacement of Node 3 and Node 9 of the unit cube by performing the variation of the length scale parameter.
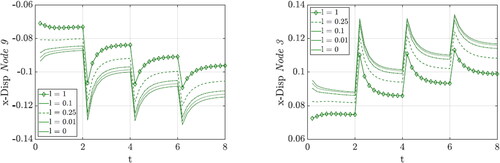
Figure 4. Evolution of the density within the unit cube by performing the variation of the penalty parameter.
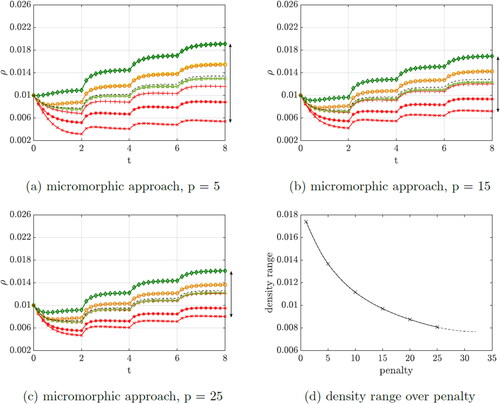
Figure 5. Evolution of the displacement of Node 3 and Node 9 of the unit cube by performing the variation of the penalty parameter.
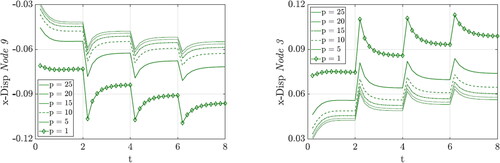
Figure 6. Comparison of the approaches.
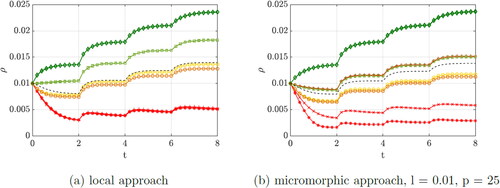
Figure 7. Cantilever beam under bending load serving as a simplified model for the femoral shaft region.
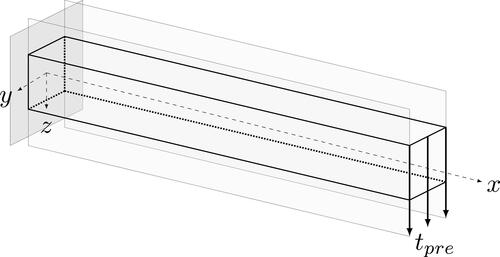
Table 3. Non-dimensionalised reference parameters for the cantilever beam.
Figure 8. Density distribution inside a bone specimen under bending load by performing the variation of the length scale parameter.
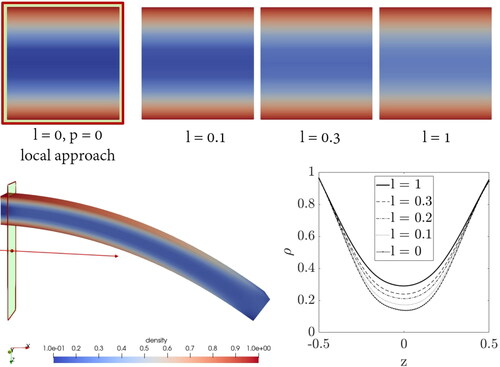
Figure 9. Density distribution inside a bone specimen under bending load by performing the variation of the penalty parameter.
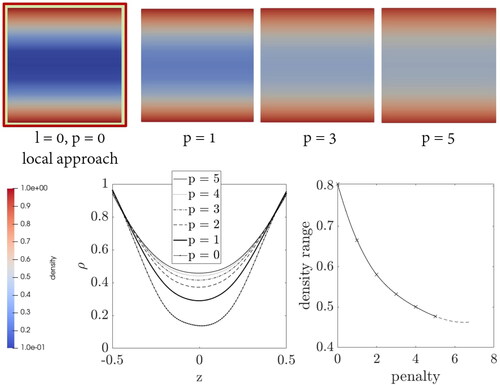
Figure 10. Density distribution inside a femoral head using the classical local approach.
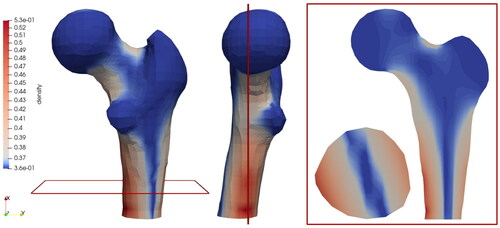
Table 4. Non-dimensionalised reference parameters for the 3D proximal femur.
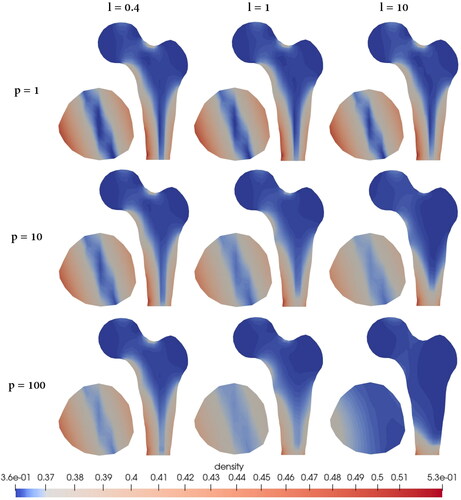
Figure 11. Density distribution inside a femoral head by performing the variation of the length scale and penalty parameter.