Figures & data
Figure 1. Simplified reinforcing frame consisting of top plate, middle plate, back plate and LCs - A. top left B. top right C. middle left D. middle right E. bottom left F. bottom right.
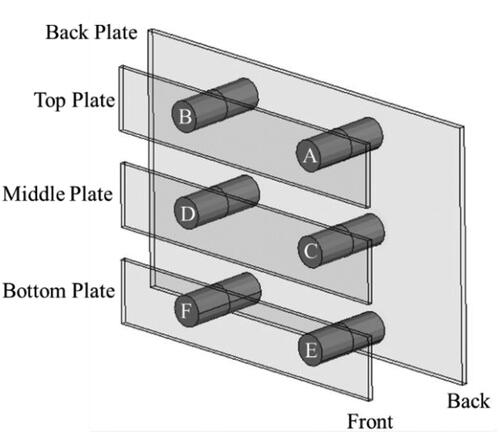
Figure 2. Sled boundary conditions. The sled floor was constrained to move in the X-direction.
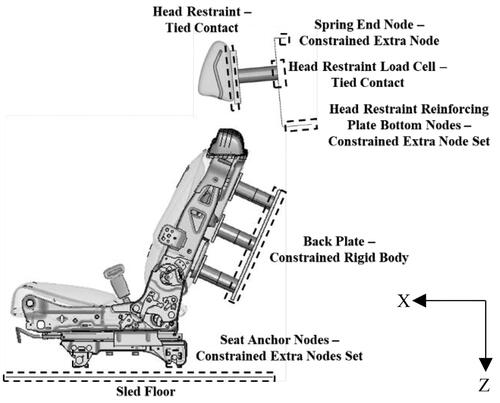
Figure 3. Sled pulse derived from experiments (Kang et al. Citation2020).
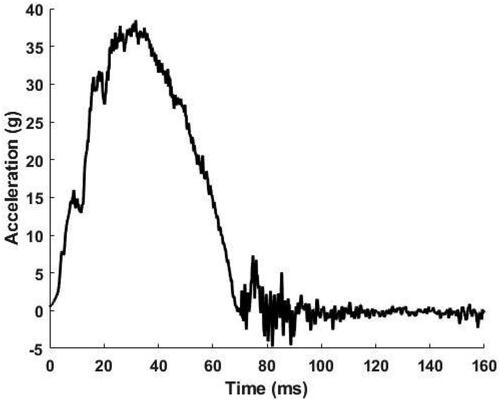
Figure 4. Spinal curvatures determined from PMHS X-ray images.
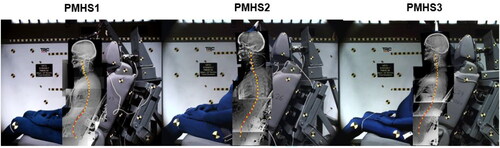
Figure 5. Corridor for spine curvature from the PMHS and adjusted GHBMC spine curvature.
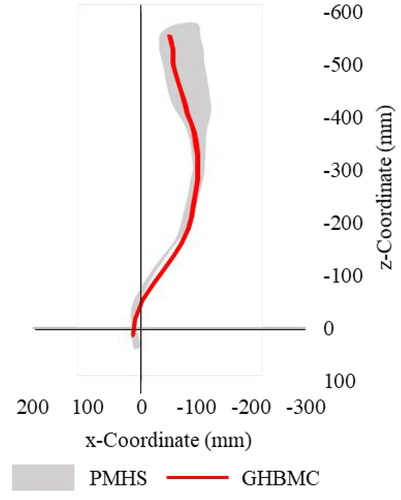
Figure 6. Final GHBMC setup based on PMHS positioning information A: Thigh angle (11.3 deg) B: Leg angle (43.5 deg) C: Pelvis angle (31.9 deg) D: Backset (95 mm) E: Topset (93.90 mm) F: Greater trochanter (GT) height (48.6 mm) G: Acromion height (563.8 mm).
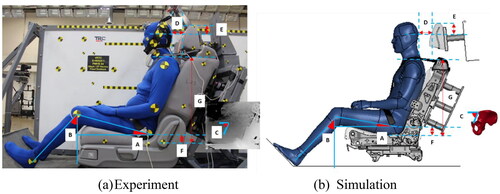
Table 1. Summary of method of alignment for dummy curves (Hagedorn et al. Citation2022), BRS score, time duration for BRS calculation, absolute value of DPS and average and maximum of absolute values of PMHS shift for occupant kinematics.
Figure 7. Evaluation of occupant response score and seat loading score. Here, Ar: Resultant acceleration, Ry: Y-rotation, Dx: X-displacement, Dz: Z-displacement, Wy: y-angular velocity, A-P: anterior-posterior and Fr: Resultant force.
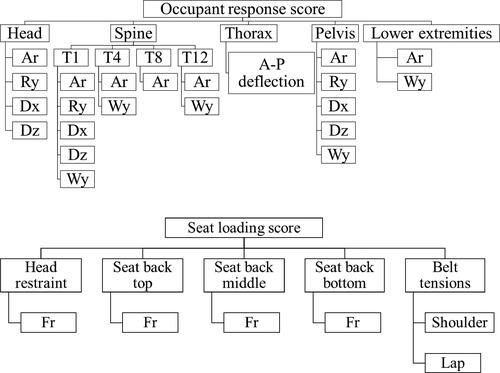
Table 2. Summary of method of alignment for dummy curves (Hagedorn et al. Citation2022), BRS score, time duration for BRS calculation, absolute value of DPS and average and maximum of absolute values of PMHS shift for seat reaction loads and belt tensions.
Figure 8. Head kinematics.
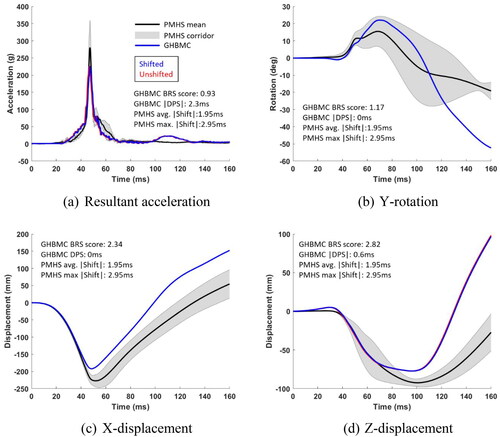
Figure 9. T1 kinematics.
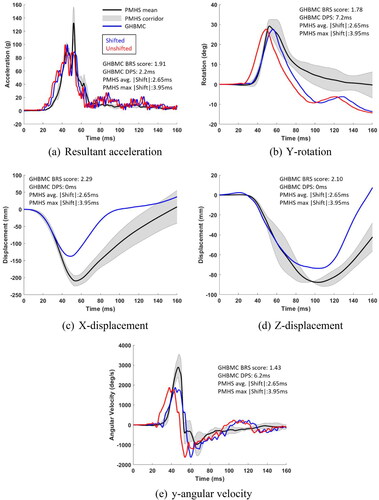
Figure 10. Pelvis kinematics.
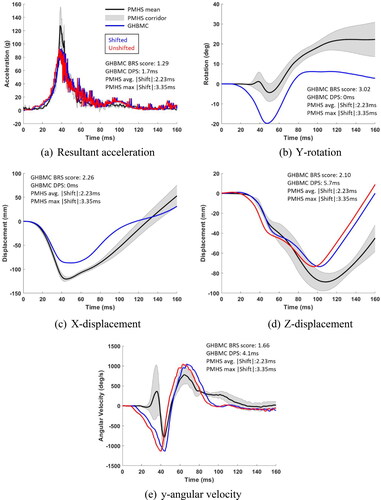
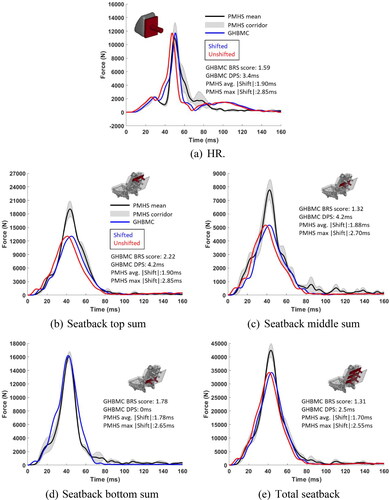
Figure 11. Seat resultant forces.