Figures & data
Figure 1 Consort flow chart of participants through the study. LTF = lost to follow-up; DSQ = dietary screening tool.
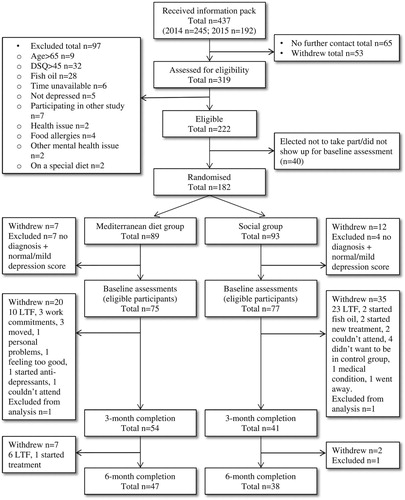
Table 1 Participant demographics and health status by treatment group (n = 152)
Figure 2 Mediterranean diet scores in each group at baseline and 3 months (P < 0.001). Bars represent standard error of the mean.
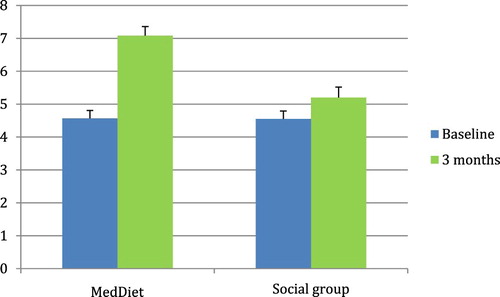
Table 2 Mediterranean diet and food group scores in Mediterranean diet (MedDiet) and Social groups at baseline, 3 and 6 months, and test of differences between groups using linear mixed modelling, n = 152 (MedDiet n = 75; social group n = 77)
Figure 3 DASS depression scores in each group at baseline and 3 months (P = 0.027). Bars represent standard error of the mean. Dotted line represents cut-off for ‘extremely severe depression’.
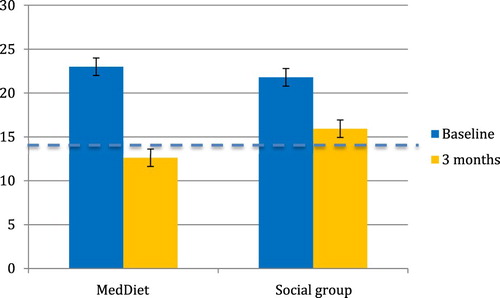
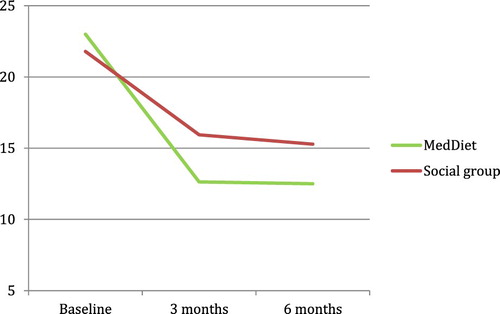
Figure 4 DASS depression scores at baseline, 3 and 6 months.