
Figures & data
Table 1. Clinical and laboratory characteristics of 331 patients with a polyneuropathy.
Figure 1. Metabolite levels and vitamin B12 levels. (a) Dot plot of vitamin B12 and methylmalonic acid levels with trend line, Pearson correlation after logarithm transformation: −0.39 (95% CI −0.48- −0.29). (b) Dot plot of vitamin B12 and homocysteine levels with trend line, Pearson correlation after logarithm transformation: −0.32 (95% CI −0.41- −0.22).
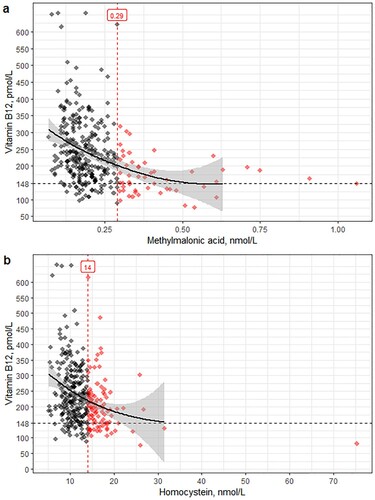
Table 2. Prevalence of elevated metabolites per vitamin B12 category.
Figure 2. Probability of elevated metabolites as function of vitamin B12 levels; predicted probabilities estimated using a logistic regression model with elevated metabolites as dependent variable and vitamin B12 level as covariate. Abbreviations: MMA, methylmalonic acid; Hcy, homocysteine.
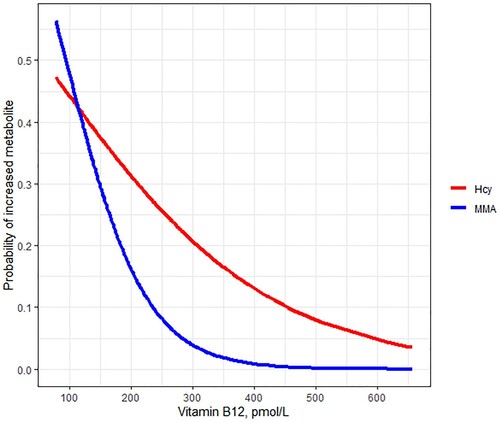
Table 3. Logistic regression for Vitamin B12 as covariate, after excluding vitamin B12 < 148 pmol/L (200 pg/mL), n = 285.
Table 4. Comparison of clinical phenotype and laboratory results between patients with absolute, metabolic and no vitamin B12 deficiency.
Table 5. Effect of vitamin B12 supplementation and prevalence of elevated metabolites, n (%).
Table 6. Results of patients with CAP compared to patients with polyneuropathy with a known underlying etiology (non-CAP).
Figure 3. ROC curves for elevated metabolites as dependent and vitamin B12 levels as covariate. Methylmalonic acid >0.29 μmol/L as dependent. Methylmalonic acid >0.29 μmol/L or homocysteine >14 μmol/L as dependent. Homocysteine >14 μmol/L as dependent. Abbreviations: MMA, methylmalonic acid; Hcy, homocysteine.
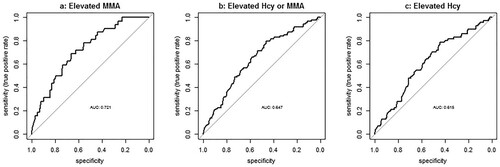
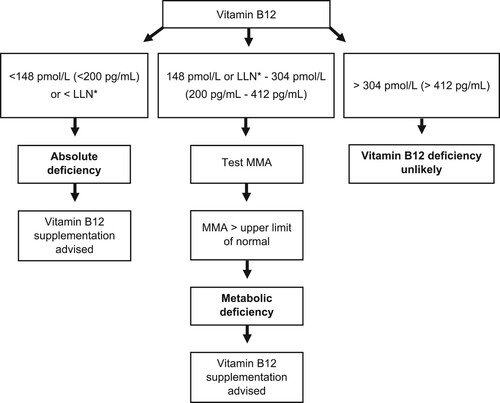
Figure 4. Flow chart for diagnosing vitamin B12 deficiency in patients with polyneuropathy. Abbreviations: LLN, lower limit of normal; MMA, methylmalonic acid.
Data availability statement
Pseudonimized data are available upon reasonable request.