Figures & data
Table 1. Fatty acid composition of the experimental diets (% of total fatty acids). CON: control diet; LOW: low n-3 diet; HIGH: high n-3 diet. ALA: α-linolenic acid; DHA: docosahexaenoic acid; DPA: docosapentaenoic acid; EPA: eicosapentaenoic acid; LA: linoleic acid; MUFAs: monounsaturated fatty acids; PUFAs: polyunsaturated fatty acids; SFAs: saturated fatty acids.
Table 2. Fatty acid composition of the olfactory mucosa and olfactory cilia (% of total fatty acids). Cilia from 6 mice were pooled into one sample. Data are expressed as the mean ± s.e.m. (for the OM, n = 5 mice/group; for the cilia, n = 3 samples in the CON and LOW groups and n = 2 samples in the HIGH group). * Values are significantly different from the CON group (Mann–Whitney U test, p < 0.05). # Sum of the percent unsaturated fatty acids multiplied by their number of double bonds. SFAs: saturated fatty acids; MUFAs: monounsaturated fatty acids; PUFAs: polyunsaturated fatty acids; DMAs: dimethyl acetals. n.d.: not detected.
Figure 1. Assessment of cilia membrane fluidity by fluorescence anisotropy (r) using TMA-DPH as a probe. Cilia from 6 mice were pooled into one sample. Data are expressed as the mean ± s.e.m. (CON, n = 4 samples; LOW, n = 2 samples; HIGH, n = 3 samples). No significant difference was observed between the CON group and the LOW or HIGH groups (Mann–Whitney U test, p < 0.05).
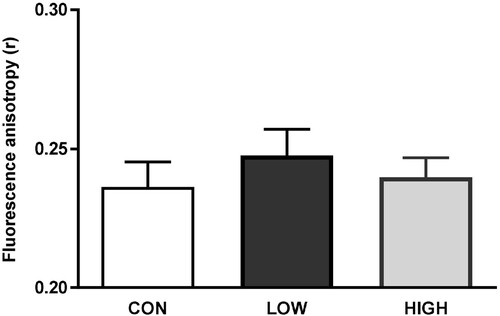
Figure 2. Gene expression in offspring olfactory mucosa. mRNA levels of genes involved in olfactory signaling pathways (A, B and C), neurogenesis (D), cellular transport (E), inflammation and resolution (F) and lipid metabolism (G) were assessed. The results are expressed as the relative quantity (RQ) compared to the CON group. Data are presented as the mean ± s.e.m. (CON, n = 8 mice; LOW, n = 8 mice and HIGH, n = 7 mice). * Values are significantly different from the CON group (Mann–Whitney U test, p<0.05).
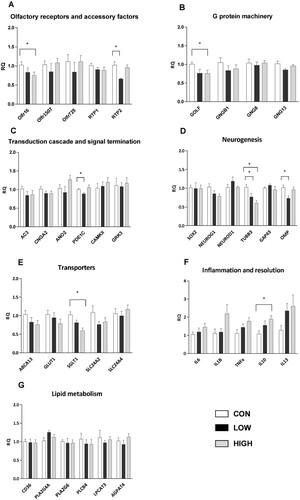
Figure 3. Analysis of electrophysiological responses of olfactory mucosa to odorants using EOG recordings on endoturbinate III. (A) Amplitude of EOG responses after stimulation by increasing concentrations of phenylethyl alcohol (PEA) and acetophenone (ACE); (B) Depolarization speed of EOG responses after stimulation by increasing concentrations of PEA and ACE; (C) Representative EOG traces recorded on OM of the CON, LOW and HIGH groups after stimulations by PEA or ACE (10−1 M). Data are expressed as the mean ± s.e.m. (CON, n = 13 mice; LOW, n = 6 mice; HIGH, n = 9 mice). ** p<0.01 and *** p<0.005 after a two-way repeated-measures ANOVA followed by Bonferroni post hoc test.
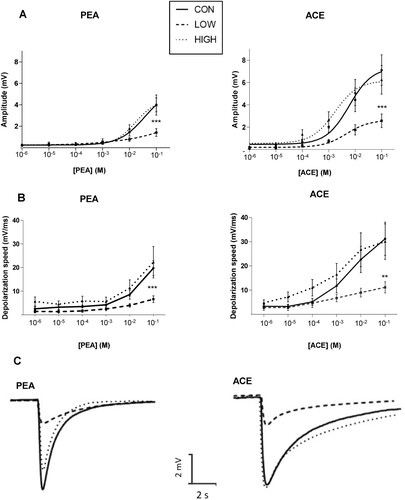
Figure 4. Odor induced sniffing behavior in response to phenylethyl alcohol (PEA) stimulation. Water (A) followed by increasing concentrations of PEA (10−9 M (B), 10−8 M (C) and 10−7 M (D)) were applied consecutively for 30 s. The respiratory frequency and inspiration amplitude were measured and integrated as a z-sniffing index. Boxes represent data included between quartile 1 and quartile 3, separated by the median; whiskers show minimum and maximum values (CON, n = 6 mice, LOW, n = 8 mice, HIGH, n = 9 mice). ** p<0.01 and ***p<0.001 after a two-way repeated-measures ANOVA followed by Bonferroni post hoc test.
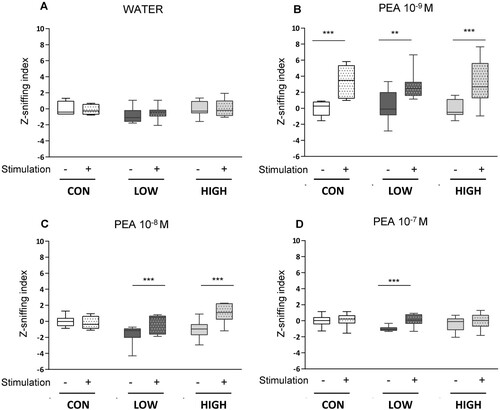
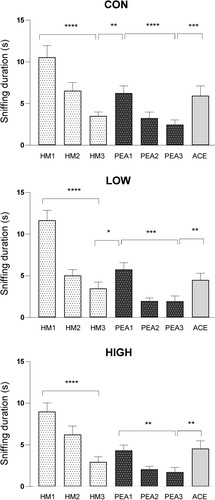
Figure 5. Assessment of olfactory discrimination capacities of mice using a habituation/dishabituation test. Animals were sequentially exposed three times to mineral oil (HM, acclimatization), three times to phenylethyl alcohol (PEA, habituation) and finally to acetophenone (ACE, dishabituation). The duration of sniffing in response to each odorant presentation was measured. Data are presented as the mean ± s.e.m. (CON, n = 24 mice; LOW, n = 21 mice; HIGH, n = 24 mice). * p<0.05, ** p<0.005; *** p<0.001, **** p<0.0001 after a two-way repeated-measures ANOVA followed by Fisher’s LSD post hoc test.