
Figures & data
Figure 1. Mean (and SEM) of odor hedonic ratings for meat odor (A), vegetable odors (B), other food odors (C), and non-food odors (D), in each diet. Error bars correspond to the standard error of the mean (SEM). Odor hedonic ratings were rated on a visual analogic scale from −9 to +9. Significant differences were noted using * p < 0.05; ** p < 0.01; *** p < 0.001.
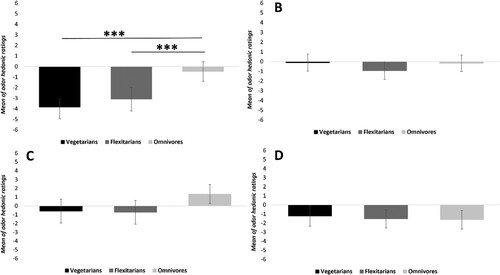
Figure 2. Mean (and SEM) of odor hedonic ratings for meat odor (A), vegetable odors (B), other food odors (C), and non-food odors (D), independently of diet. Error bars correspond to the standard error of the mean (SEM). Odor hedonic ratings were rated on a visual analogic scale from −9 to +9. Significant differences were noted using * p < 0.05; ** p < 0.01; *** p < 0.001.
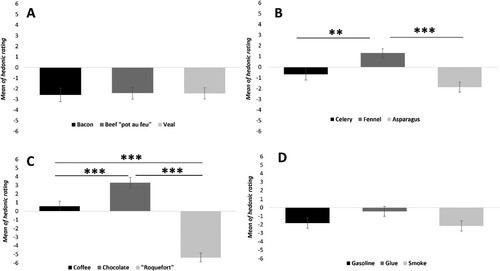
Figure 3. Mean (and SEM) of odor intensity ratings for meat odor (A), vegetable odors (B), other food odors (C), and non-food odors (D), in each diet. Error bars correspond to the standard error of the mean (SEM). Significant differences were noted using *p < 0.05; **p < 0.01; ***p < 0.001.
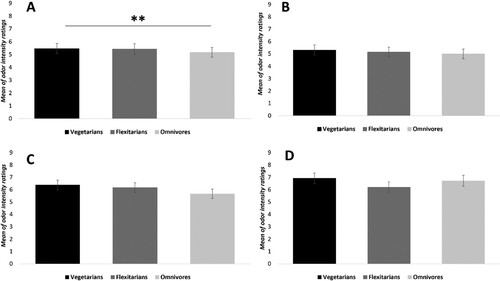
Figure 4. Mean (and SEM) of odor intensity ratings for meat odor (A), vegetable odors (B), other food odors (C), and non-food odors (D), independently of diet. Error bars correspond to the standard error of the mean (SEM). Significant differences were noted using * p < 0.05; **p < 0.01; ***p < 0.001.
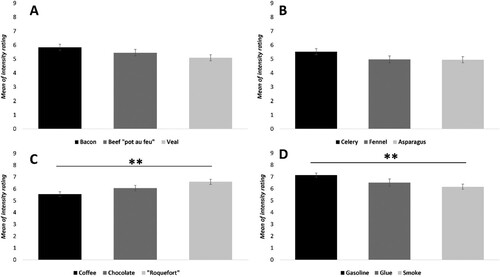
Figure 5. Mean (and SEM) of odor edibility ratings for meat odor (A), vegetable odors (B), other food odors (C), and non-food odors (D), in each diet. Error bars correspond to the standard error of the mean (SEM). Significant differences were noted using *p < 0.05; **p < 0.01; ***p < 0.001.
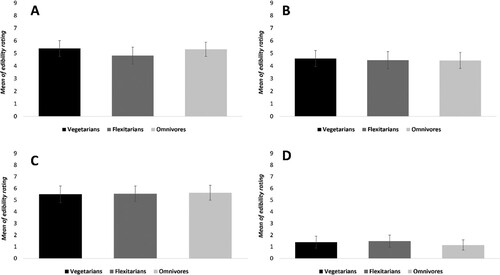
Figure 6. Mean (and SEM) of odor edibility ratings for meat odor (A), vegetable odors (B), other food odors (C), and non-food odors (D), independently of diet. Error bars correspond to the standard error of the mean (SEM). Significant differences were noted using *p < 0.05; **p < 0.01; ***p < 0.001.
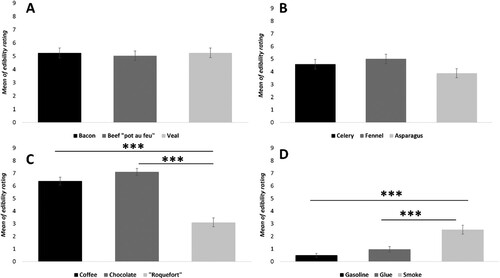
Table 1. Spearman correlations for Hedonicity/Intensity, Hedonicity/Edibility, and Intensity/Edibility for each diet and each odor category.
Data availability statement
The data that support the findings of this study are available from the corresponding author upon reasonable request.