
Figures & data
Table 1. Dietary composition of diets used in the study. Normal chow diet (NCD); Proprietary high-fat diet (PHFD); Commercial high-fat diet (C-HFD).
Figure 1. MUFA-rich sucrose-supplemented P-HFD influences whole body metabolism. A. Proximate dietary composition of fat, protein, and carbohydrates in NCD, HFD and C-HFD (expressed as percentage of diet). B. Fatty acid composition of SFA, MUFA, and PUFA in NCD, HFD, and C-HFD (expressed as percentage of diet). C. Heatmap and quantification comparing NCD, P-HFD, and C-HFD groups in 24-hour calorimetric analysis for food intake at week 1, week 3, and week 8 of diet. D. Heatmap and quantification comparing NCD, P-HFD, and C-HFD groups in 24-hour calorimetric analysis for water consumption at week 1, week 3, and week 8 of diet. E. Heatmap and quantification comparing NCD, P-HFD, and C-HFD groups in 24-hour calorimetric analysis for average VO2 at week 1, week 3, and week 8 of diet. F. Heatmap and quantification comparing NCD, P-HFD, and C-HFD groups in 24-hour calorimetric analysis for average CO2 at week 1, week 3, and week 8 of diet. G. Heatmap and quantification comparing NCD, P-HFD, and C-HFD groups in 24-hour calorimetric analysis for average RER at week 1, week 3, and week 8 of diet. H. Heatmap and quantification comparing NCD, P-HFD, and C-HFD groups in 24-hour calorimetric analysis for average energy expenditure at week 1, week 3, and week 8 of diet. (n = 3–4/group, *p<0.05, **p<0.001, ****p<0.0001). SFA, saturated fatty acids, MUFA, monounsaturated fatty acids, PUFA, polyunsaturated fatty acids, RER, respiratory exchange ratio. Data are mean ± SEM.
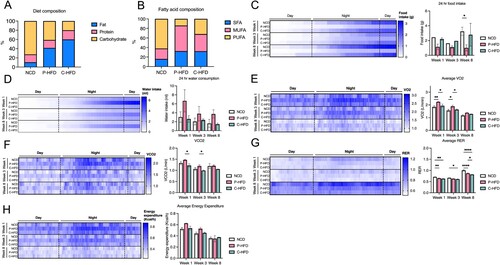
Figure 2. Glucose intolerance precedes weight gain on P-HFD. A. Timeline depicting the duration of P-HFD administration to C56BL6/J mice and metabolic testing (ITT and GTT), and behavioral assessment timepoints. B. Weight analysis across 32 weeks for NCD and P-HFD mice. C. AUC analysis for weight against time for NCD and P-HFD mice. D. End weight analysis at week 32 for NCD and P-HFD mice (NCD, n = 9, P-HFD, n = 24, *p<0.05). E. Non-fasting glycemia measurements for NCD and P-HFD mice for 32 weeks. F. AUC analysis for non-fasting glycemia levels against time in NCD and P-HFD mice. G. End non-fasting glycemia analysis at week 32 for NCD and P-HFD mice (NCD, n = 9, P-HFD, n = 24). H. GTT curve for animals at 11–13 weeks of feeding depicting glycemia levels across 120 min (left), and AUC analysis (right) for glycemia against time in NCD and P-HFD mice (NCD, n = 5, P-HFD, n = 5, p<0.05). I. ITT curve for NCD and P-HFD mice at 11–13 weeks of feeding depicting glycemia levels across 120 min (left), and AUC analysis (right) for glycemia against time in NCD and P-HFD mice (NCD, n = 5, P-HFD, n = 5). J. GTT curve for animals at 28–32 weeks of feeding depicting glycemia levels across 120 min (left), and AUC analysis (right) for glycemia against time in NCD and P-HFD mice (NCD, n = 9, P-HFD, n = 9, p<0.05). K. ITT curve for animals at 28–32 weeks of feeding depicting glycemia levels across 120 min (left), and AUC analysis (right) for glycemia against time in NCD and P-HFD mice (NCD, n = 7, P-HFD, n = 15). L. Weight analysis for tissues collected from NCD and P-HFD at 13 weeks (NCD, n = 5, P-HFD, n = 5, *p<0.05). M. Weight analysis for tissues collected from NCD and P-HFD at 32 weeks (NCD, n = 4, P-HFD, n = 7, *p<0.05). GTT, glucose tolerance test, ITT, insulin tolerance test, SWAT, subcutaneous white adipose tissue, EWAT, epididymal white adipose tissue, BAT, brown adipose tissue. Data are mean ± SEM.
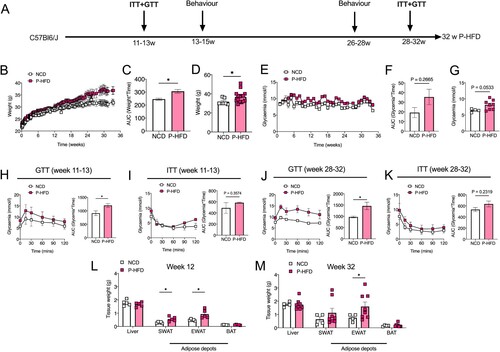
Figure 3. P-HFD causes mild metabolic dysfunction compared to C-HFD. A. Weight analysis across 32 weeks for NCD, P-HFD, and C-HFD mice (NCD, n = 6, P-HFD, n = 7, C-HFD = 6, *p<0.05, **p<0.01, ****p<0.0001). B. AUC analysis for weight against time for NCD, P-HFD, and C-HFD mice (NCD, n = 6, P-HFD, n = 6, C-HFD = 6, *p<0.05, **p<0.01). C. End weight analysis at week 32 for NCD, P-HFD, and C-HFD mice (NCD, n = 6, P-HFD, n = 6, C-HFD = 6, **p<0.01). D. Fasting glycemia levels in NCD, P-HFD, and C-HFD mice at 6 weeks of diet (NCD, n = 6, P-HFD, n = 7, C-HFD = 6, ***p<0.001). E. Fasting glycemia levels in NCD, P-HFD, and C-HFD mice at 13 weeks of diet (NCD, n = 6, P-HFD, n = 6, C-HFD = 6, ***p<0.001). F. GTT curve for P-HFD and C-HFD mice at 13 weeks of diet (P-HFD, n = 6, C-HFD = 6) G. AUC analysis for GTT curve for P-HFD and C-HFD mice at 13 weeks of feeding. H. ITT curve for P-HFD and C-HFD mice at 13 weeks of feeding depicting glycemia levels across 120 min (P-HFD, n = 6, C-HFD, n = 6, *p<0.05). I. AUC analysis for ITT curve for P-HFD and C-HFD mice at 13 weeks of feeding (P-HFD, n = 6, C-HFD = 6). J. Weight analysis for tissues collected from NCD and P-HFD at 32 weeks (P-HFD, n = 8, C-HFD, n = 6, *p<0.05, ****p<0.0001). GTT, glucose tolerance test, ITT, insulin tolerance test, SWAT, subcutaneous white adipose tissue, EWAT, epididymal white adipose tissue, BAT, brown adipose tissue. Data are mean ± SEM.
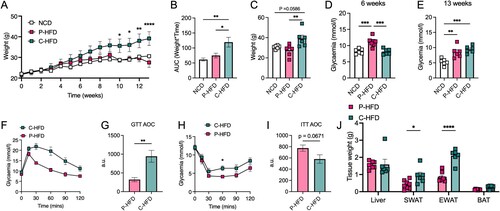
Figure 4. Short-term P-HFD induces anxiety-like behavior, without affecting memory or depression. A. Heatmap representative traces of NCD, P-HFD, C-HFD, and db/db mice on the testing phase of the NOR task depicting time spent investigating the novel object (asterisk). B. Discrimination index of NCD, P-HFD, C-HFD, and db/db mice in the testing phase of the NOR task. C. Recognition index of NCD, P-HFD, C-HFD, and db/db mice in the testing phase of the NOR task (*p<0.05, **p<0.01, NCD, n = 12, P-HFD, n = 9, C-HFD, n = 9, db/db, n = 7). C. D. Mobility time of NCD, P-HFD, C-HFD, db/db mice in the FST. E. Immobility time of NCD, P-HFD, C-HFD, and db/db mice in the FST. F. Immobility episodes of NCD, P-HFD, C-HFD, and db/db mice in the FST. (*p<0.05, **p<0.01, ***p<0.001, ****p<0.0001, NCD, n = 15, P-HFD, n = 11, C-HFD, n = 11, db/db, n = 9). G. Representative activity traces of NCD, P-HFD, C-HFD and db/db mice on the OFT. H. Total distance traveled in the OFT for NCD, P-HFD, C-HFD, and db/db mice. I. Time spent in the central zone for NCD, P-HFD, C-HFD, and db/db mice in the OFT. J. Number of entries to the central zone for NCD, P-HFD, C-HFD, and db/db mice in the OFT. K. The distance traveled in the central zone for NCD, P-HFD, C-HFD, and db/db mice in the OFT, expressed as percentage of total distance traveled. (*p<0.05, **p<0.01, ***p<0.001, NCD, n = 14, P-HFD, n = 10, C-HFD, n = 10, db/db, n = 8). Data are mean ± SEM.
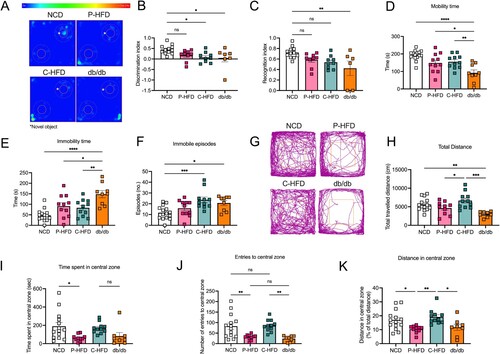
Figure 5. Long-term P-HFD feeding sustains anxiety-like behaviors and impairs memory. A. Heatmap representative traces of NCD and P-HFD on the testing phase of the NOR task depicting time spent investigating the novel object (asterisk). B. Discrimination index P-HFD and NCD mice in the testing phase of the NOR task. C. Recognition index of NCD and P-HFD mice in the testing phase of the NOR task (*p<0.05, NCD, n = 12, P-HFD, n = 8). D. AUC analysis for latency during the acquisition phase of the MWM task for NCD, and P-HFD mice. E. AUC analysis for distance traveled during the acquisition phase of the MWM task for NCD, and P-HFD mice. F. Percentage time spent in the target vs. the other quadrants in the MWM probe trial for NCD and P-HFD mice (*p<0.05, NCD, n = 7, P-HFD, n = 12). G. Mobility time of NCD and P-HFD mice in the FST. H. Immobility time of NCD and P-HFD mice in the FST. I. Immobility episodes of NCD and P-HFD mice in the FST (NCD, n = 11, P-HFD, n = 16). J. N. Representative activity traces of NCD and mice on the OFT. K. Total distance traveled in the OFT for NCD and P-HFD mice. L. Number of entries to the central zone for NCD and P-HFD mice in the OFT. M. The distance traveled in the central zone for NCD and P-HFD mice in the OFT, expressed as percentage of total distance traveled. N. Time spent in the central zone for NC and P-HFD mice in the OFT (*p<0.05, **p<0.01, NCD, n = 14, P-HFD, n = 11). Data are mean ± SEM.
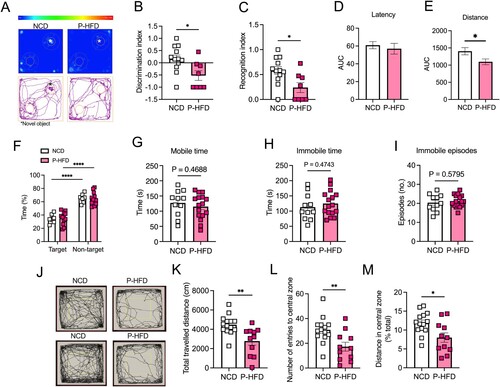
Figure 6. P-HFD induces glucose hypometabolism in the brain and white adipose tissue and influences the brain transcriptome. Representative PET/CT whole-body scan of A. NCD, B. P-HFD mice. Images are displayed according to the intensity scale for tracer activity, from red (highest), green (intermediate), to purple (lowest). Quantitative ex vivo analysis of 18FDG uptake in C. brain, D. liver, E. SWAT, F. EWAT, and G. BAT of NCD and P-HFD mice. (NCD, n = 6, P-HFD, n = 6) (*p<0.05, **p<0.01). H. Transcriptomic analyses of the forebrain and hindbrain following NCD of P-HFD feeding (forebrain NCD, n = 5, P-HFD, n = 5; hindbrain NCD, n = 4, P-HFD, n = 5). Heatmaps represent differentially expressed genes (p>0,05, +/−1.5-fold change, between diets, per tissue). I. Panther pathway enrichment analysis from forebrain and hindbrain. J. Target gene expression from transcriptomic analysis of genes in glucose metabolism. SWAT, subcutaneous white adipose tissue, EWAT, epididymal white adipose tissue, BAT, brown adipose tissue. Data are mean ± SEM.
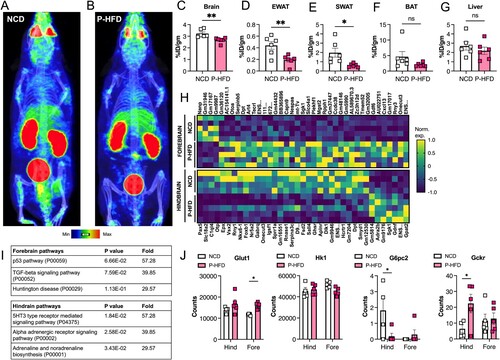
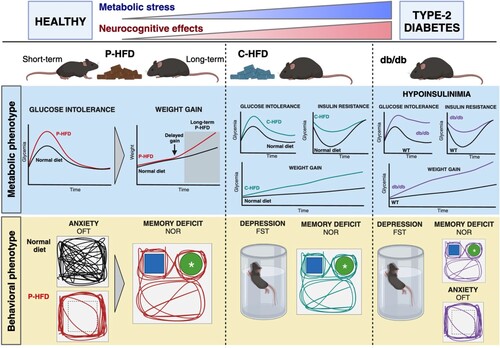
Figure 7. Dysregulation of specific metabolic components is associated with neurocognitive effects. A proprietary high-fat diet (P-HFD) that induces glucose intolerance is associated with anxiety-like behavior in mice, this is followed by weight gain and onset of memory deficits. On a commercial high-fat diet (C-HFD), glucose intolerance, insulin resistance and obesity induce depressive tendencies and memory deficits. A genetic model of T2D (db/db) results in depression, anxiety, and depressive tendencies. (FST: forced swim test; OFT: Open field test; NOR: novel object recognition; WT wild type). Created with BioRender.com.
Supplemental Fig 2.jpg
Download JPEG Image (391.2 KB)
Supplemental fig1.jpg
Download JPEG Image (1.1 MB)
Data availability statement
The authors declare that all data associated with the current study are available from the corresponding author upon reasonable request. Gene raw counts and raw fastq files for RNA-seq data generated in this study are available on GEO repository.
Author statement
All authors have read and approved the final version of the manuscript. The authors declare no conflict of interest and contributed to the study as follows; MA-O: conceptualization, investigation, formal analysis, writing original draft, writing review editing, funding acquisition; KB: investigation, formal analysis; SK: formal analysis, writing review editing; DAlt: formal analysis, writing review editing; SD: investigation; DAla: investigation; HA: investigation; MA: investigation; AK: investigation; RN: investigation; MRW: investigation; RA: formal analysis, writing review editing; HA: formal analysis, writing review editing; FA-M: writing review editing, funding acquisition; FAlz: investigation, formal analysis, writing original draft, funding acquisition.