Figures & data
Table 1. The socio-demographic and clinical characteristics of case group
Table 2. Model fitting results for one – to five-class solutions in LCA models.
Figure 1. Comparison of the baseline and post-treatment vitamin D mean from the three latent profiles.
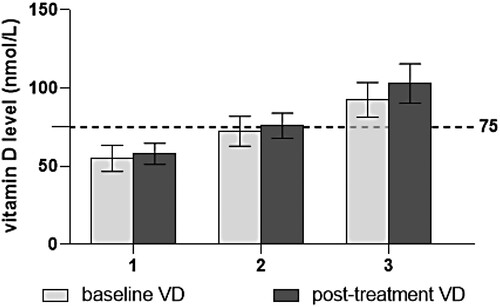
Table 3. Descriptive statistics for vitamin D level subgroup disaggregated by latent profile class.
Figure 2. Logistic regression analysis models showing the associations between SDS improvement and vitamin D latent profiles (medium-level profile as the reference). Crude model: Unadjusted model. Model 1: Adjusted for age, gender, BMI, smoking and admission season. Model 2: Additionally adjusted for disease course, number of episodes, duration of this episode, and psychiatric treatment.
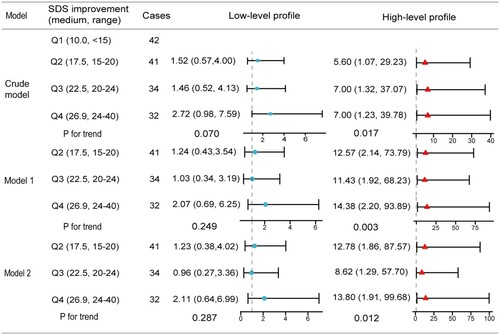
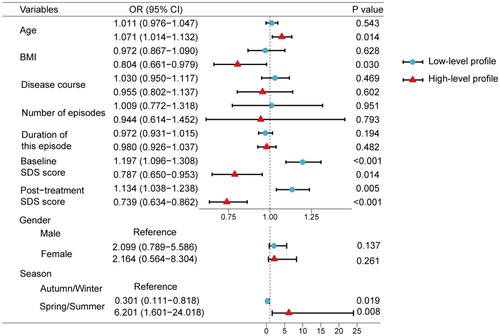
Figure 3. Odds ratios for the socio-demographic and clinical variables predicting latent profile membership. Abbreviation: OR odds ratio; CI Confidence interval.