
Figures & data
Table 1. Active variables creating the space of political attitudes in Sweden.
Table 2. Citizen’s media policy attitudes (percentages).
Figure 1. The Swedish space of political attitudes. MCA, axis 1 and 2. Missing values (including “I don’t have an opinion”) have been removed (n = 874). - - = “I don’t agree at all”, - = “I don’t agree”, + = “I agree”, + + = “I fully agree”.
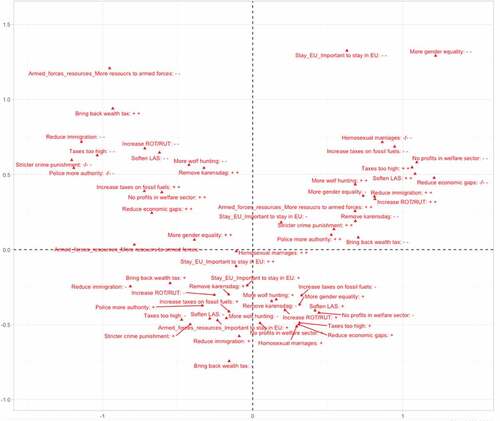
Figure 2. Projecting media policy attitudes into the Swedish space of political attitudes. MCA, axis 1 and 2. Missing values (including “I don’t have an opinion”) have been removed (n = 874). - - = “I don’t agree at all”, - = “I don’t agree”, + = “I agree”, + + = “I fully agree”.
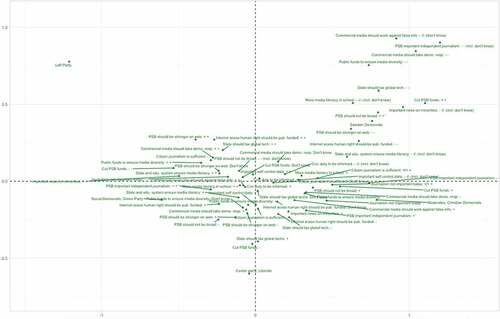
Table A1. Benzécri-adjusted eigenvalues of the top 10 dimensions among the active variables.
Table A2. Relations of active variable modalities to dimensions 1 and 2 (eta squared).
Table A3. V-test for modalities in supplementary variables on the two main dimensions.