Figures & data
Figure 1. Throsby’s (Citation2008) concentric circles model.
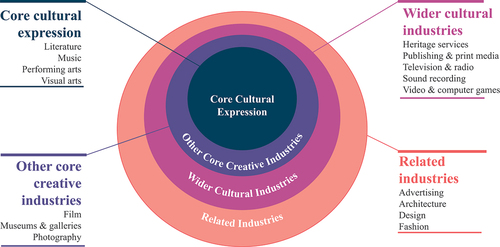
Table 1. Final codes for analyzing the CCCF frames in project descriptions.
Figure 2. Evolution of totally or partially funded Norwegian CCCF campaigns in the period of 2016–2021 on the Kickstarter and Bidra platforms.
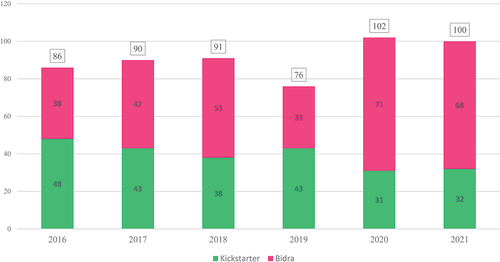
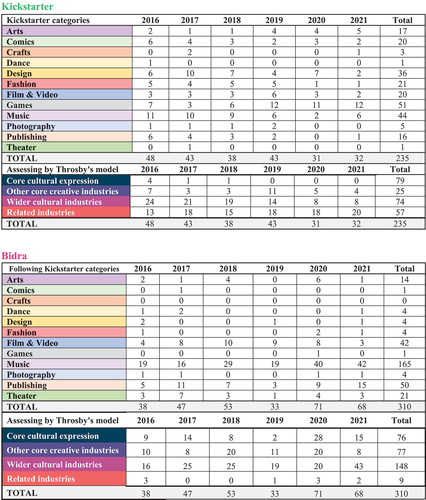
Figure 3. Comparison of the totally or partially funded Norwegian cultural crowdfunding campaigns on Kickstarter versus Bidra in 2016–2021, categorized according to Kickstarter’s tags.
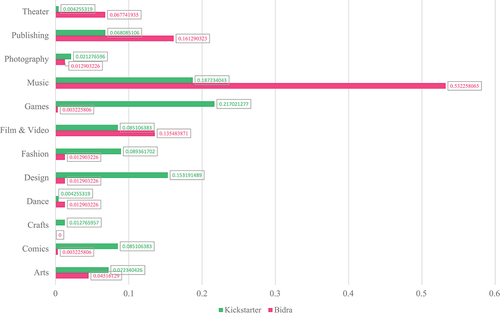
Figure 4. Comparison of the totally or partially funded Norwegian cultural crowdfunding campaigns on Kickstarter versus Bidra in 2016–2021, categorized according to Throsby’s (Citation2008) concentric circle model.
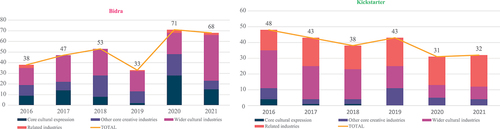
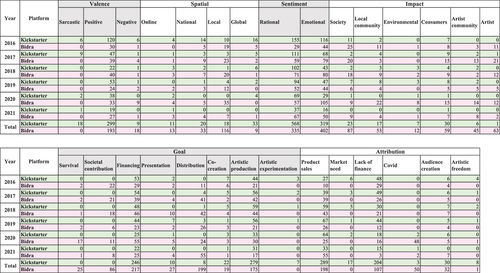
Figure 5. Number of references per code within the sentiment frame in project descriptions on Kickstarter and Bidra platforms in 2016–2021.
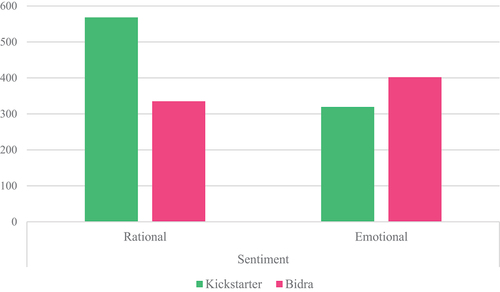
Figure 6. Number of references per code within the goal frame in project descriptions on Kickstarter and Bidra platforms in 2016–2021.
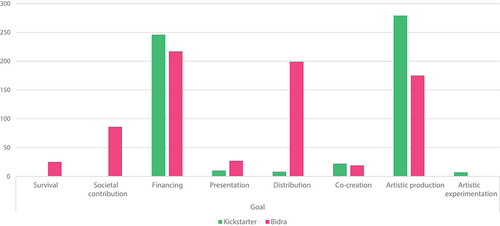
Figure 7. Number of references per code within the impact frame in project descriptions on Kickstarter and Bidra platforms in 2016–2021.
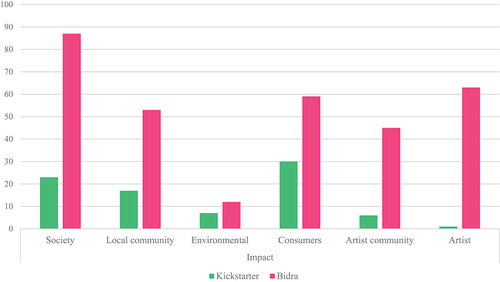
Figure 8. Number of references per code within the attribution frame in project descriptions on Kickstarter and Bidra platforms in 2016–2021.
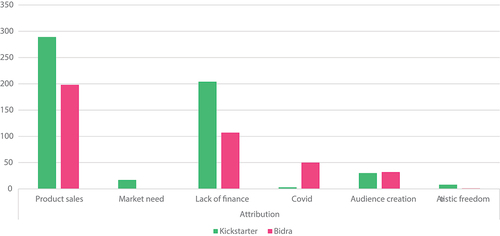
Figure 9. Number of references per code within the valence frame in project descriptions on Kickstarter and Bidra platforms in 2016–2021.
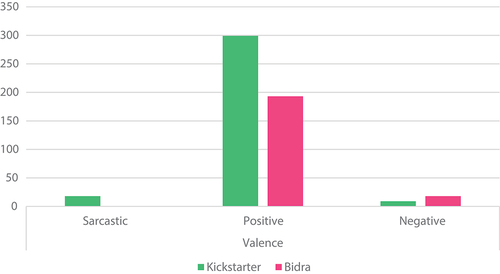
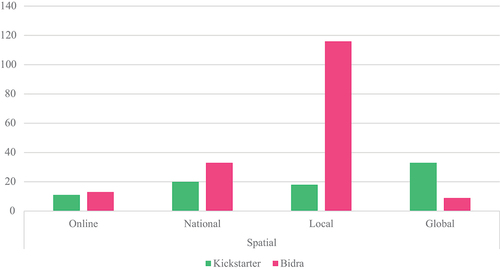
Figure 10. Number of references per code within the spatial frame in project descriptions on Kickstarter and Bidra platforms in 2016–2021.