Figures & data
Table 1. Sample selection process.
Table 2. Materiality threshold categories used to categorise the size of discontinued operations.
Figure 1. Frequency plots of materiality thresholds based on revenue and total assets.
Table 3. Descriptive statistics on the total sample.
Table 4. Descriptive statistics based on revenue thresholds (n = 129).
Table 5. Descriptive statistics based on total assets thresholds (n = 102).
Figure 2. Box plots of the revenue ratios of the bottom three revenue materiality threshold categories (n=39).
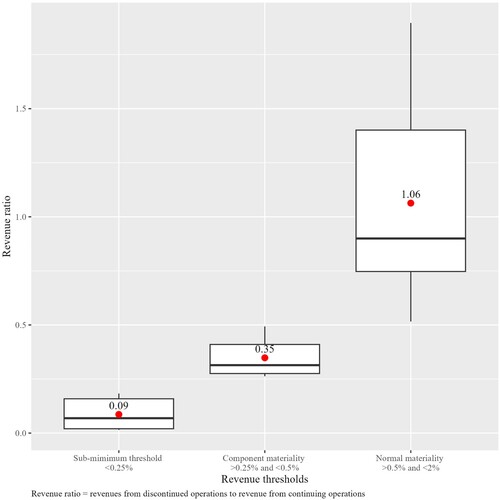
Figure 3. Box plots of the total asset ratios of the bottom three asset materiality threshold categories (n=29).
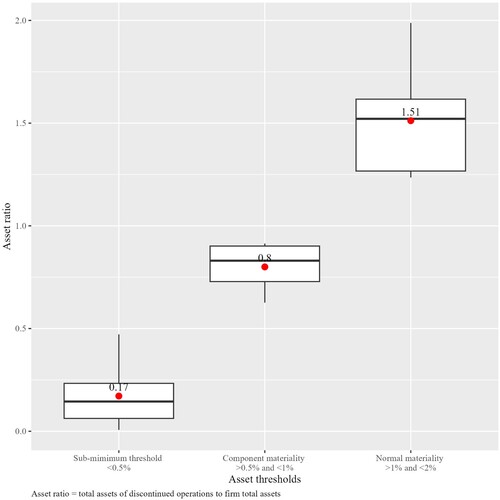
Figure 4. Frequency plots of materiality thresholds by loss-making discontinued operations.
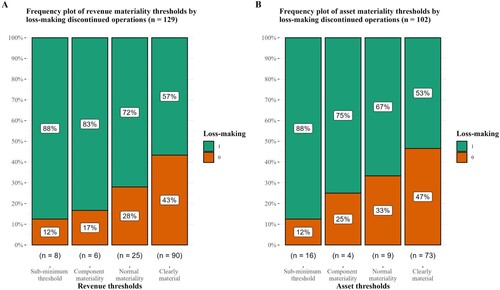
Figure 5. Frequency plots of materiality thresholds by firms audited by a Big Four auditor.
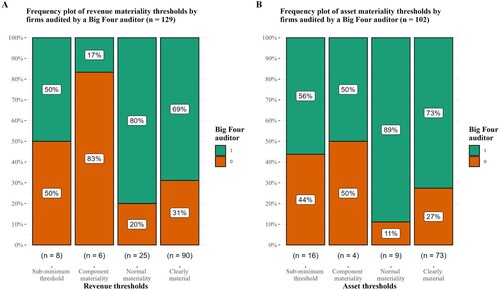
Figure 6. Frequency plots of materiality thresholds by firms that avoid losses
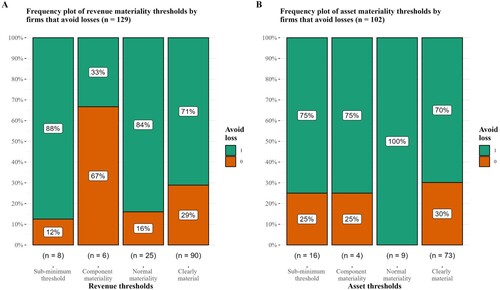
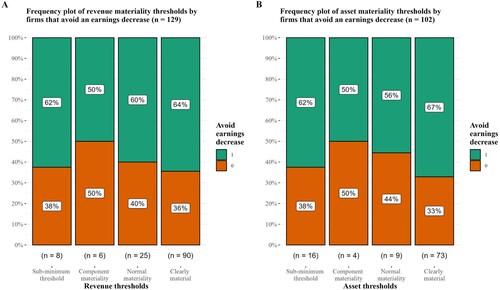
Figure 7. Frequency plots of materiality thresholds by firms that avoid an earnings decrease.