Figures & data
Table 1. Descriptive statistics and unit root tests for country index returns.
Figure 1. Heatmaps of Pearson correlation matrices for unfiltered (left) and filtered (right) returns.
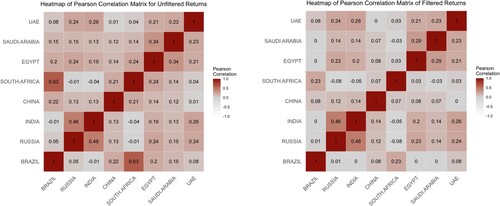
Table 2a. DCC(1,1) model estimation results: unfiltered.
Table 2b. DCC(1,1) model estimation results: filtered.
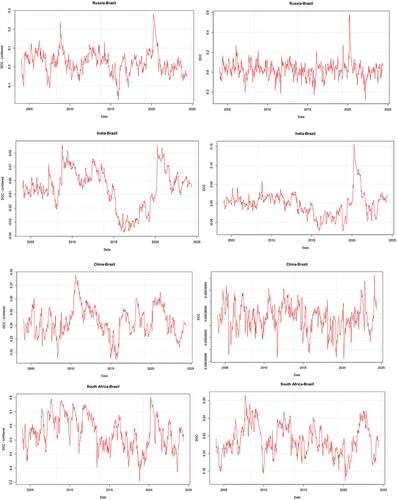
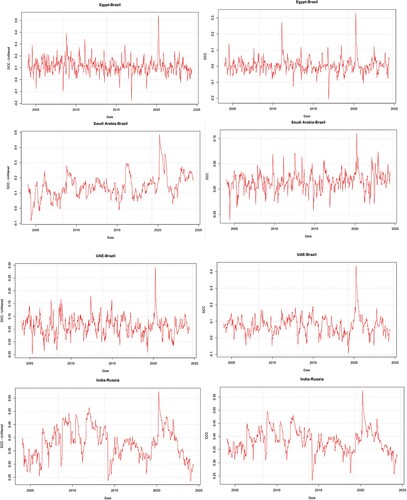
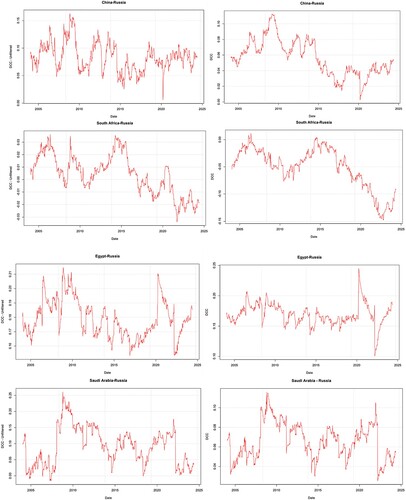
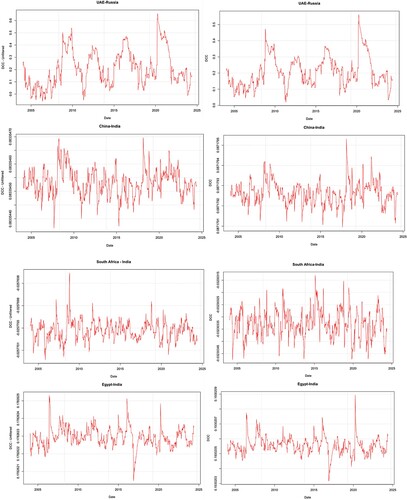
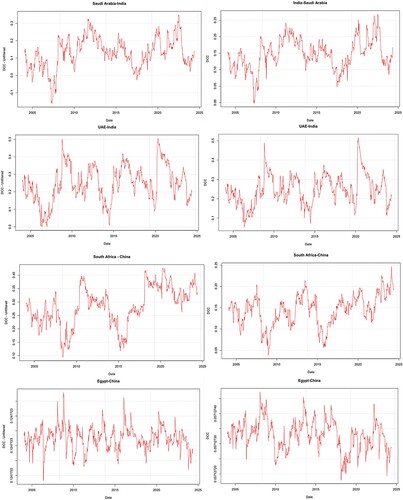
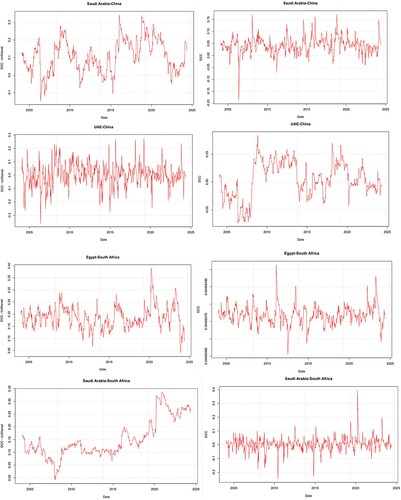
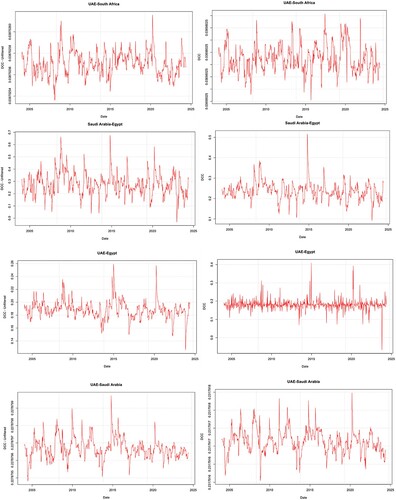
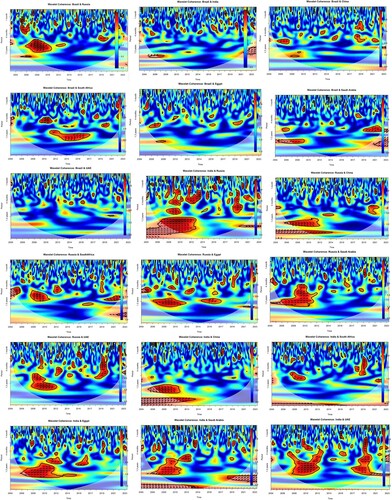
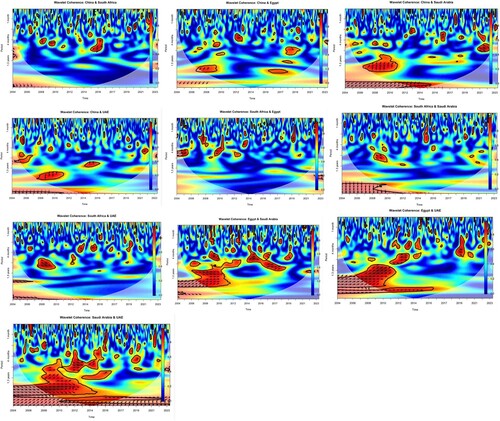
Table 3. Summary of DCC plots: unfiltered versus filtered.