Figures & data
Figure 1. The diagram of the homogenisation technique.
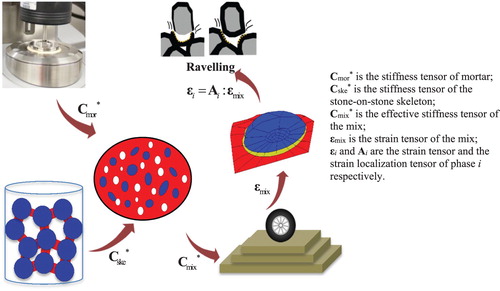
Figure 2. Illustration for the MT model.
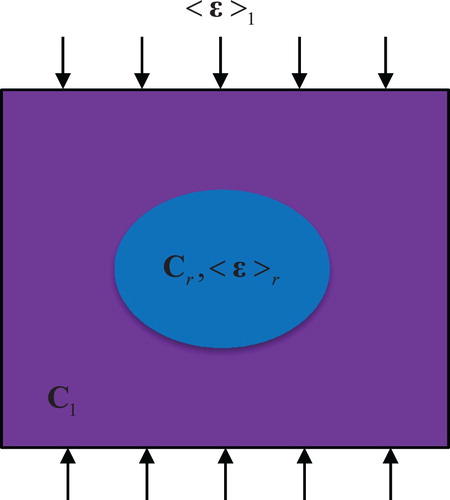
Figure 3. Configurations of different asphalt mixes.
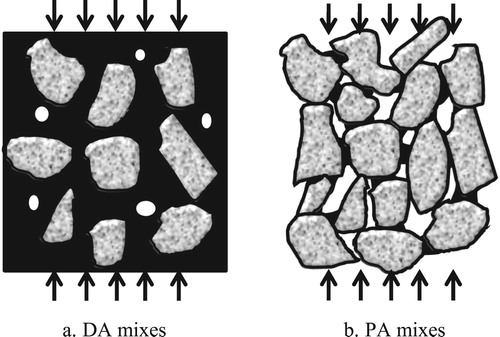
Figure 4. Illustration of the MT model for PA mixes.
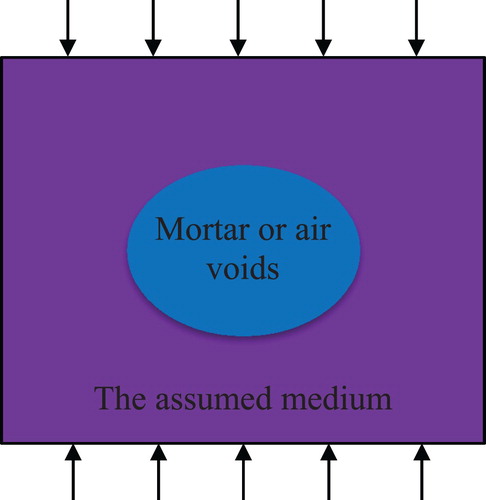
Figure 5. Workflow diagram.
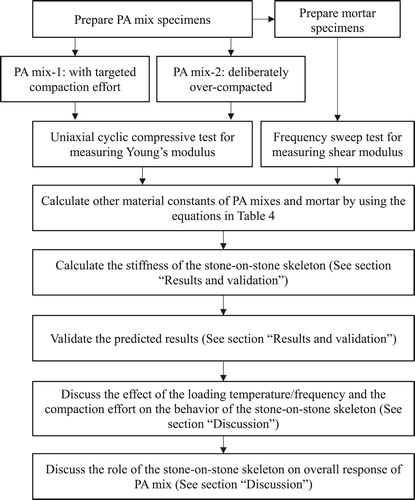
Table 1. Gradation and density of aggregates.
Table 2 . The volume fraction of each phase.
Table 3. Gradation of aggregates in mortar.
Figure 6. Preparation of mortar specimens.
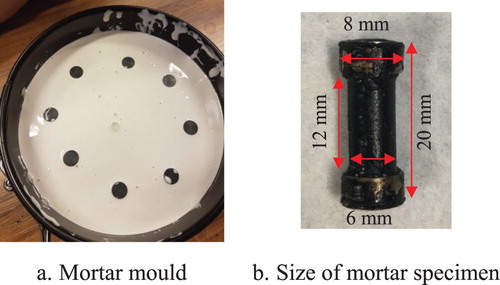
Figure 7. DSR setup for mortar tests.
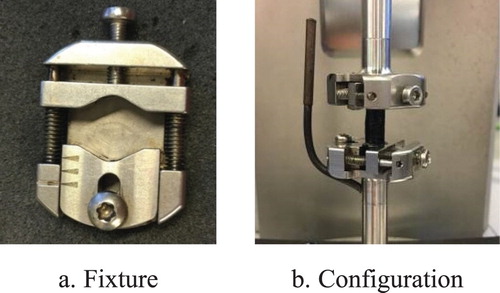
Figure 8. Setup for the uniaxial cyclic compressive test.
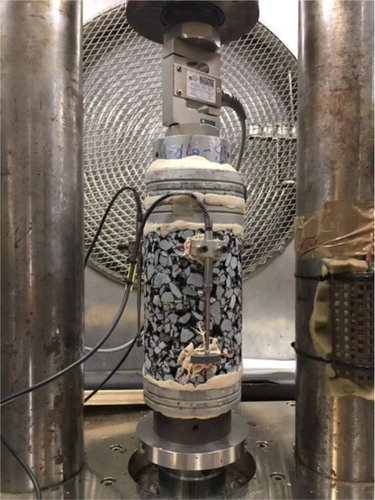
Table 4. Mechanical properties of PA mixes and mortar.
Figure 9. Predicted results of the stone-on-stone skeleton’s stiffness.
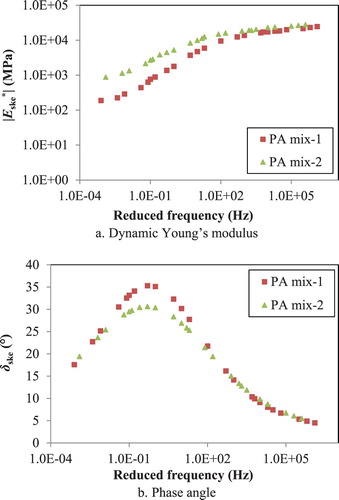
Figure 10. Modified arrangement of the Christensen’s model.
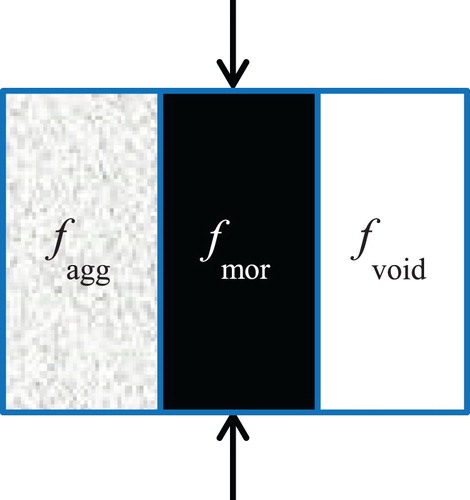
Figure 11. Comparison between and faggPaEagg.
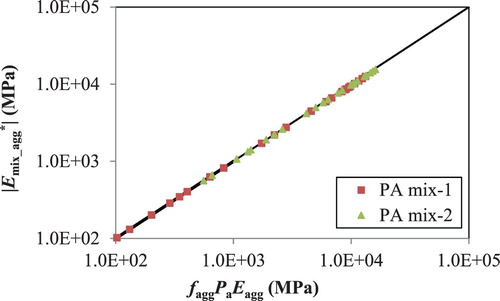
Figure 12. Comparison between tested and back-calculated
.
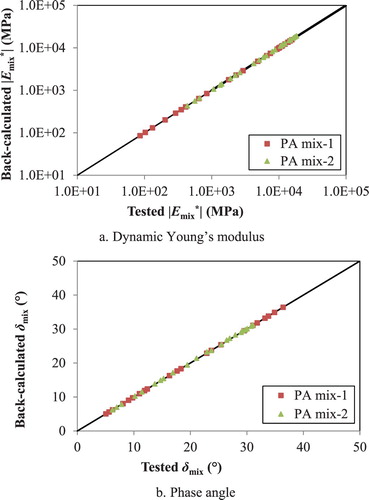
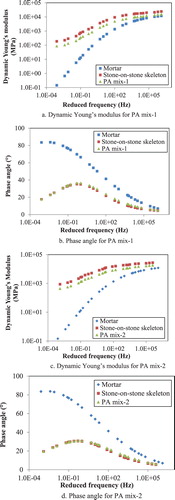
Figure 13. The behaviour of the stone-on-stone skeleton at different frequencies/temperatures.
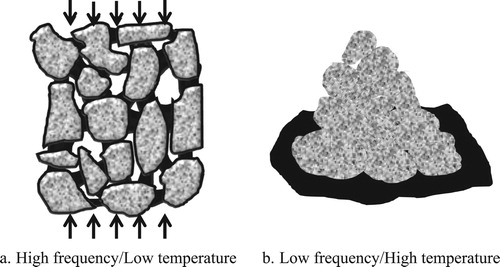
Figure 14. The behaviour of the stone-on-stone skeleton with different amount of compaction effort.
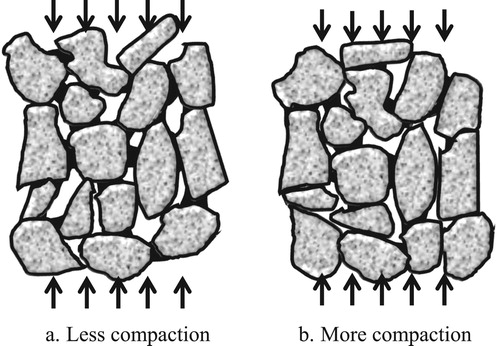
Figure 15. Comparison of stiffness between the stone-on-stone skeleton with mortar and PA mixes.