Figures & data
Table 1. Specifications of PEN 70/100 at fresh (unaged) state.
Table 2. Ageing programme.
Figure 1. Master curves of PEN 70/100 bitumen with ageing time (oven ageing at 100°C and 1 atm).
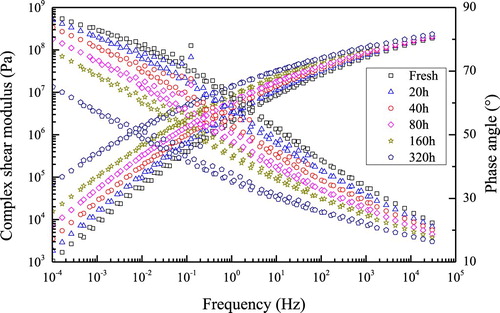
Figure 2. Black diagram of PEN 70/100 bitumen with ageing time (oven ageing at 100°C and 1 atm).
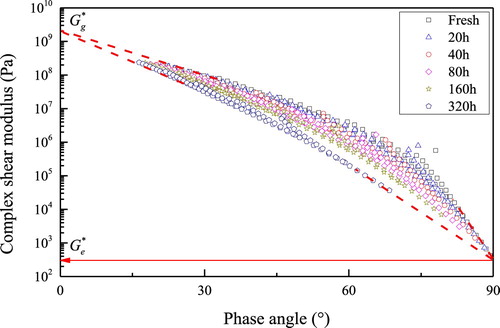
Figure 3. Schematic of crossover modulus.
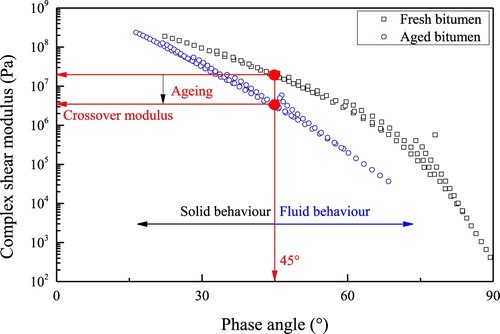
Figure 4. Crossover modulus of bitumen at different ageing conditions.
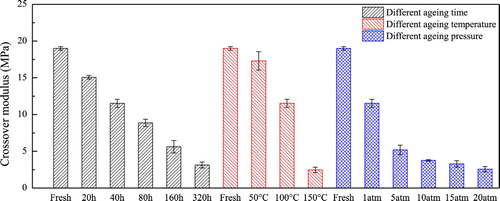
Figure 5. Ageing index of crossover modulus of bitumen at different ageing conditions.
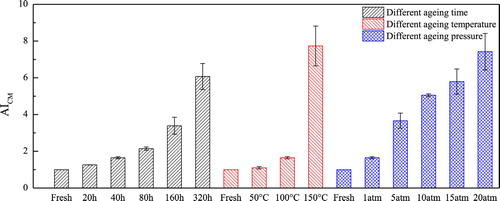
Figure 6. Complex shear modulus vs number of cycles for bitumen at fresh conditions (unaged state): stress-controlled mode (left) and strain-controlled mode (right).
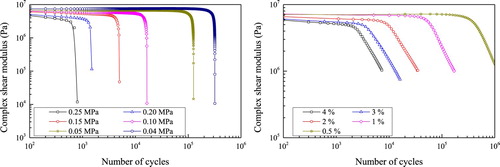
Figure 7. Fatigue results of bitumen with various ageing time: stress-controlled mode (left) and strain-controlled mode (right).
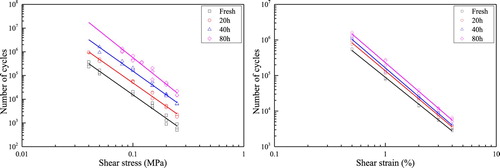
Table 3. Fitting parameters for fatigue results.
Figure 8. Relaxation curves (left) and residual stress curves (right) of PEN 70/100 at different ageing conditions.
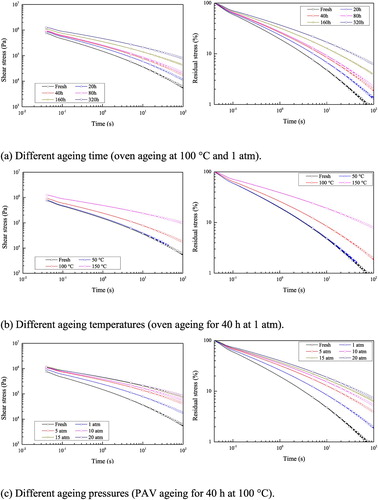
Figure 9. Shear stress of PEN 70/100 at 0 and 100 s under different ageing conditions.
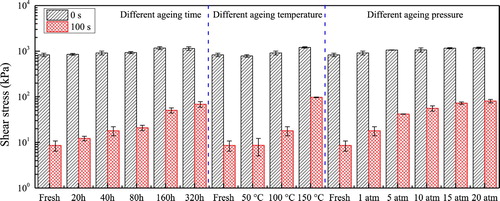
Figure 10. Relaxation time at shear stress levels of 50% and 25% of the initial stress.
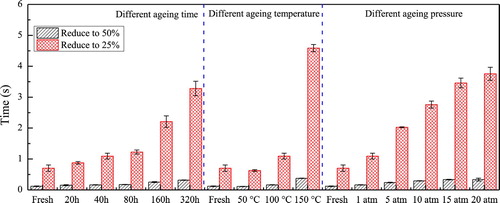
Figure 11. Ageing index of relaxation of bitumen at different ageing conditions.
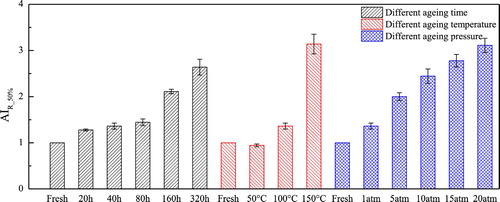
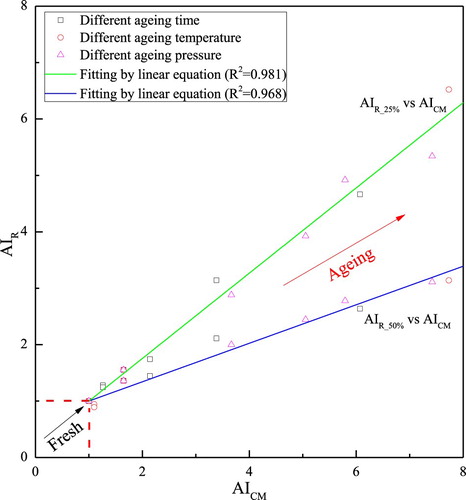
Figure 12. Relationship between the crossover modulus and the stress relaxation
ageing indices.
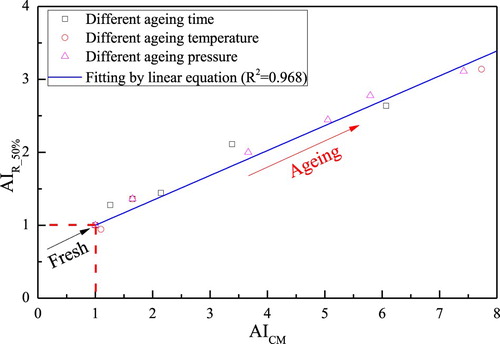
Figure 13. Relationship between the crossover modulus and the stress relaxation
ageing indices at shear stress levels of 50% and 25% of the initial stress.