Figures & data
Figure 1. Cross-sections of pavement structures SE 14, SE 18 and SE 20 and the vertical location of the instrumentation.
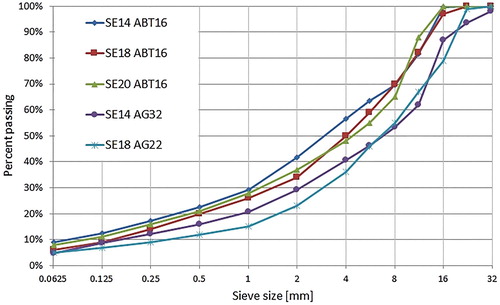
Figure 2. Gradation curves for asphalt mix types ABT 16, AG 22 and AG 32 (Arvidsson Citation2014).
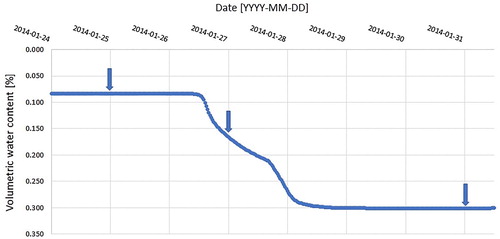
Table 1. Material, binder type, binder content and air void content for all bound layers (Arvidsson Citation2014).
Table 2. Types of unbound materials and results of plate loading test subgrade (Ev2 and Ev2/Ev1) (Arvidsson Citation2014).
Table 3. Temperature and groundwater levels used in the study.
Figure 3. Volumetric water content measurements for SE 14 showing test dates (arrows).
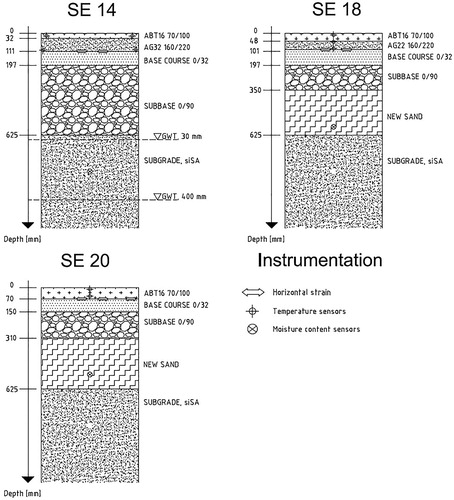
Figure 4. (a) FWD measurements, (b) measured horizontal strain at the bottom of the asphalt bound layers for structure SE 18.
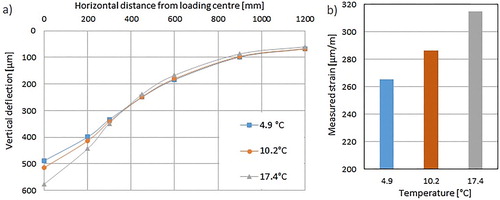
Figure 5. (a) FWD measurements, (b) measured horizontal strain at the bottom of the asphalt bound layers for structure SE 20.
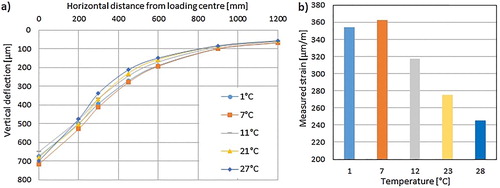
Figure 6. (a) FWD measurements, (b) measured horizontal strain at the bottom of the asphalt bound layers for structure SE 14.
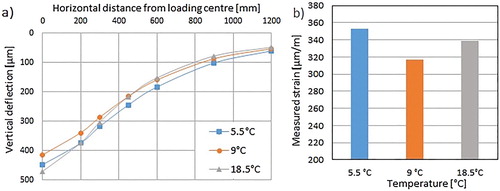
Figure 7. (a) FWD measurements at 10°C with varying groundwater levels, (b) measured horizontal strain at the bottom of the asphalt bound layers for structure SE 14.
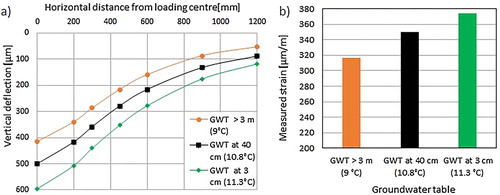
Figure 8. (a) Measured and predicted values of horizontal strain at the bottom of the asphalt layer using Equation (1) and (b) Equation (2) with respect to the 45° equality line.
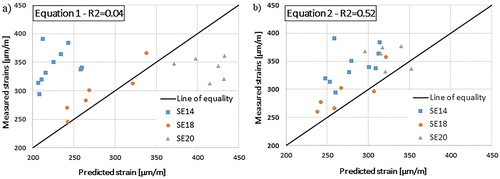
Table 4. ANOVA analysis with moisture content as an independent variable.
Table 5. ANOVA analysis without moisture content as an independent variable.
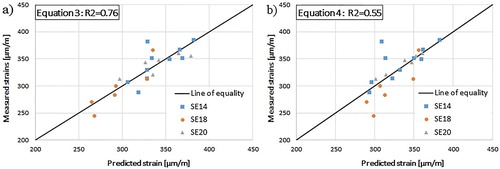
Figure 9. Measured and predicted values of horizontal strain at the bottom of the asphalt layer using (a) Equation (3) and (b) Equation (4) with respect to the 45° equality line.