Figures & data
Figure 1. Framework of the article.
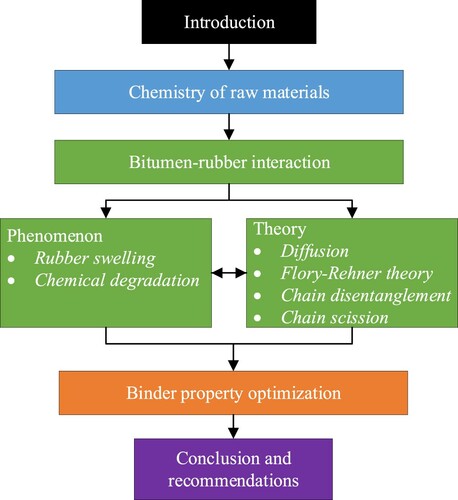
Table 1. Physiochemical properties of bitumen and the SARA fractions (Daly Citation2017, Lesueur Citation2009).
Figure 2. Chemical structure of (a) cis-polyisoprene, (b) copolymer SBR and (c) crosslinking after vulcanisation, adapted from Mark (Citation2009).
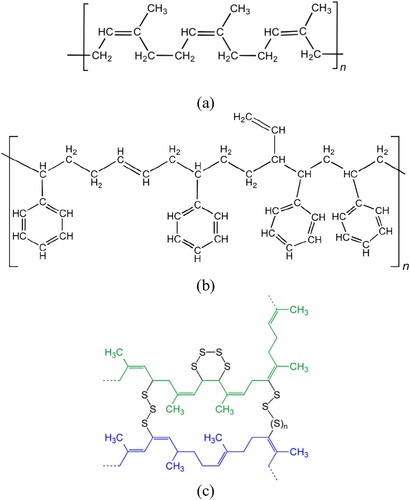
Table 2. Composition comparison of different tires in the EU, adapted from Etrma (Citation2016).
Figure 3. Typical TGA curve of crumb rubber from scrap tires.
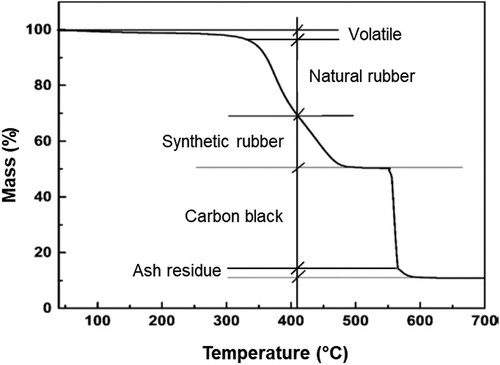
Figure 4. Schematic representation of the molecules of (a) the uncrosslinked polymer and (b) the crosslinked polymer (links are pictured as knots), adapted from Mark et al. (Citation2013).
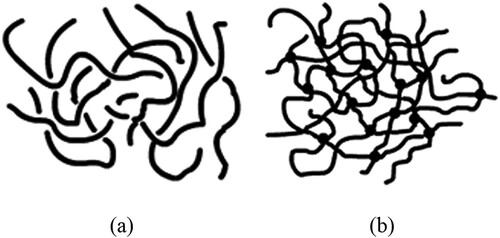
Table 3. Average bond energies of chemical bonds typically in CRMB.
Figure 5. Interaction stages of bitumen and rubber, adapted from Wang et al. (Citation2017a).
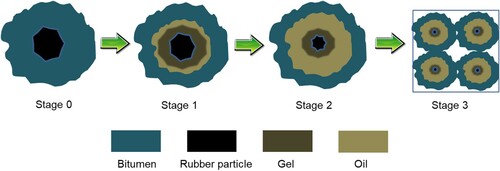
Figure 6. Interaction stages of rubber when mixed with bitumen.
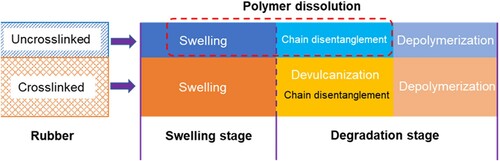
Figure 7. Schematic representation of the dissolution process for polymer molecules, blue lines represent polymer chains and yellow dots represent solvent molecules. (a) polymer molecules in solid state just after being added to a solvent; (b) a swollen polymeric gel; (c) solvated polymer molecules dispersed into a solution.
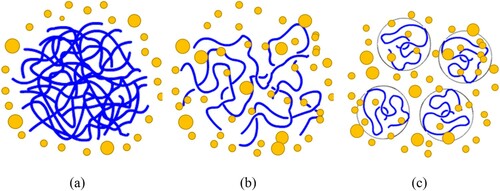
Figure 8. A schematic diagram of a one-dimensional solvent diffusion and polymer dissolution process, adapted from Narasimhan (Citation2001).
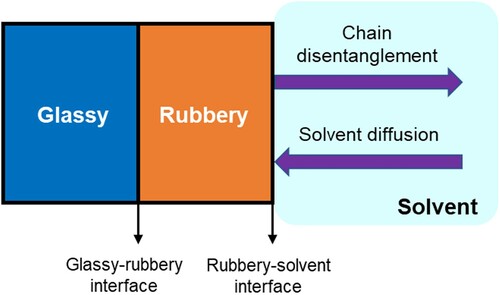
Figure 9. Polymer dissolution process from a molecular scale.
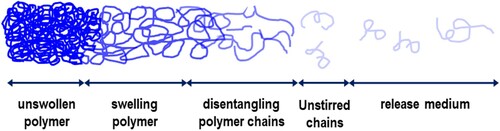
Figure 10. Schematic representation of the surface layer structure, adapted from Miller-Chou and Koenig (Citation2003).
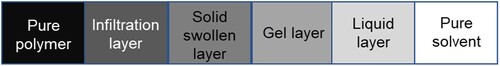
Figure 11. Reptation model for entangled polymer chains.
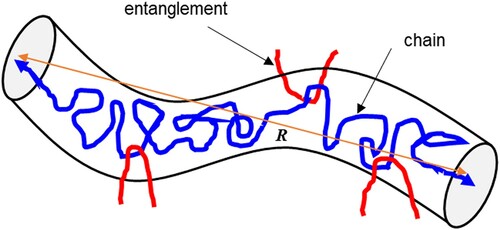
Table 4. Diffusion coefficients and equilibrium mass uptake of bitumen into rubber.
Figure 12. Viscosity evolution of CRMB over time at different interaction temperatures.
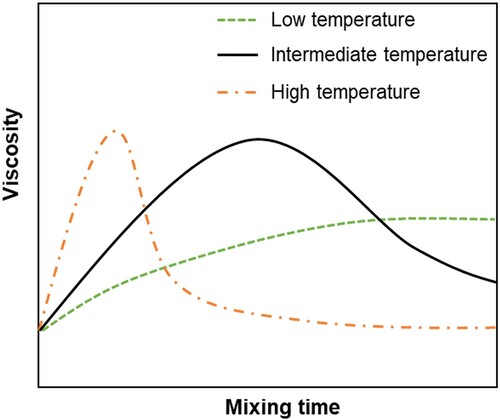
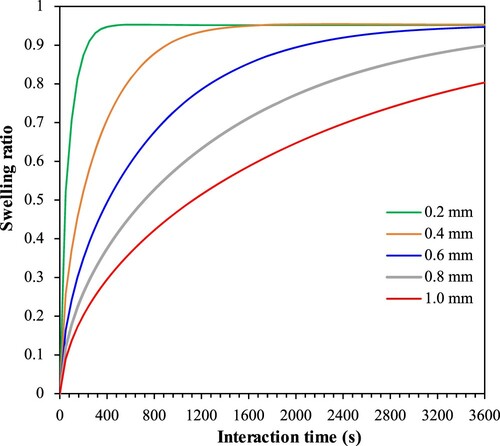
Figure 13. Swelling ratios of rubber particles of different sizes over the course of time.