Figures & data
Figure 1. Sketch of loading device.
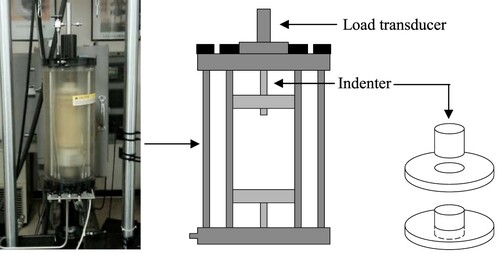
Figure 2. Principle diagram of the proposed test. (a) Mechanical model of pavement structure (red arrow: traffic load; black arrow: lateral confinement). (b) Principle diagram of the traditional triaxial test (c) Principle diagram of the proposed test.
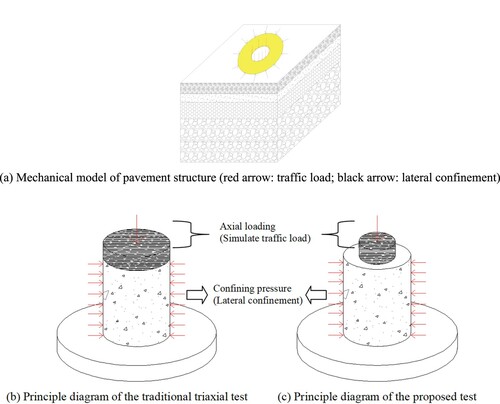
Figure 3. Relationship between indenter-force and indenter-displacement.
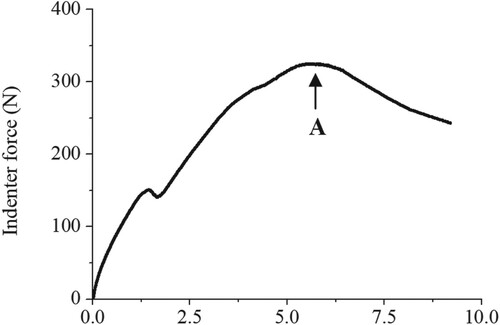
Table 1. Lab test results of aggregate packing composed of D1.
Table 2. Lab test results of aggregate packing composed of D1 and D2.
Table 3. Lab test results of aggregate packing composed of D1–D3.
Table 4. Lab test results of aggregate packing composed of D1–D4.
Table 5. Lab test results of aggregate packing composed of D1–D5.
Table 6. Lab test results of aggregate packing composed of D–D6.
Table 7. Lab test results of aggregate packing composed of D1–D7.
Figure 4. f of P1–P7.
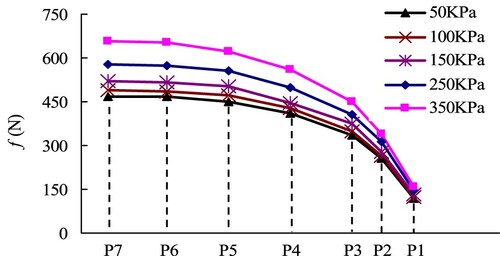
Figure 5. Procedure for a randomly generated numerical model.
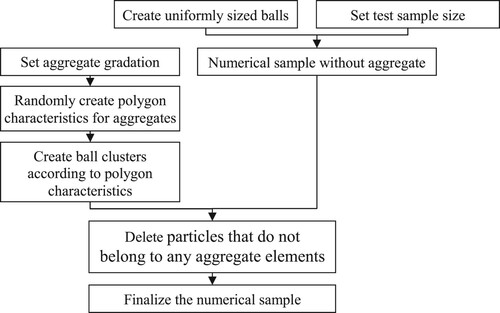
Figure 6. Numerical specimen.
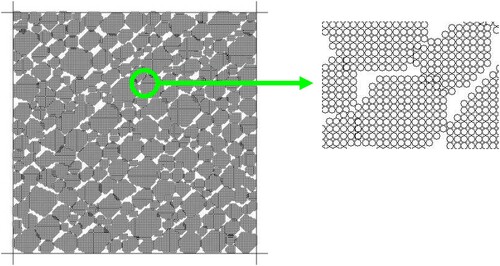
Figure 7. Numerical specimen.
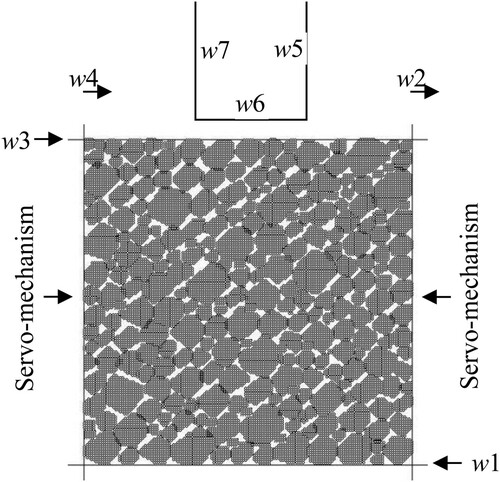
Figure 8. Average values of the errors (P1–P7) in the case of using different friction coefficients.
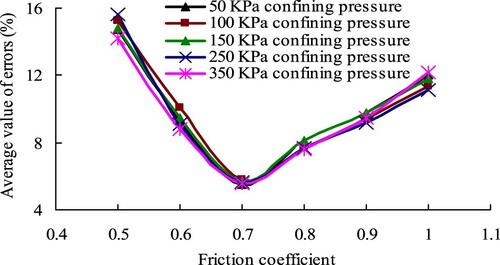
Table 8. Input parameters for DEM simulations.
Table 9. Errors between laboratory data and simulation results.
Table 10. Distribution of aggregate contact force in different aggregate packing.
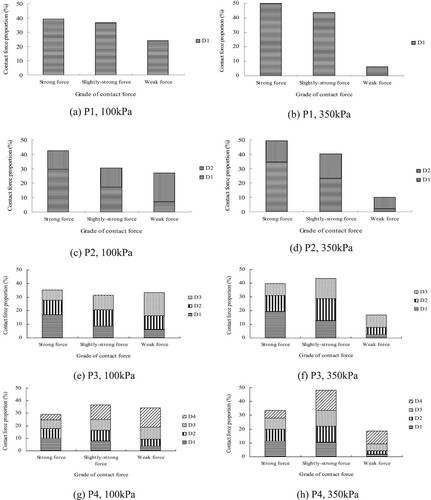
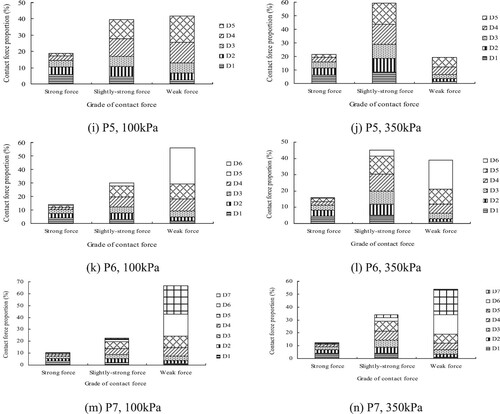
Table 11. Specification gradation.
Figure 10. The optimal mass proportion of different aggregates in P5.
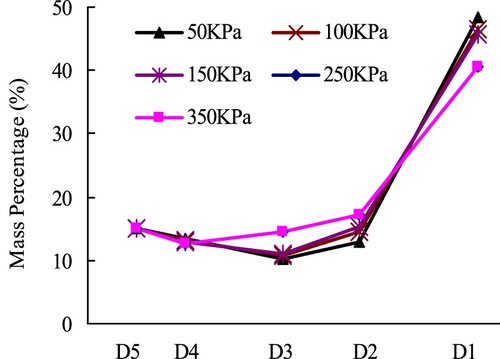
Figure 11. Comparison between specification gradation and proposed gradation. (a) Asphalt concrete. (b) Cement stabilised macadam.
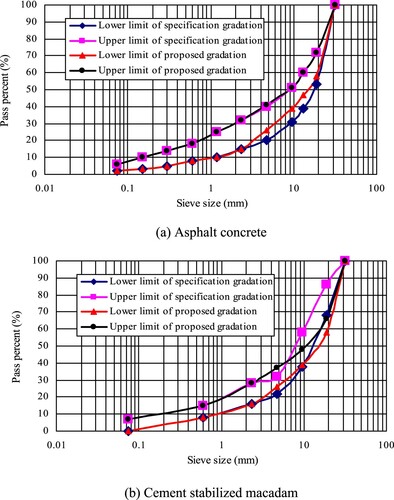
Table 12. Gradation calculation.
Table 13. Proposed gradation.
Table 14. Pavement performance of road materials.
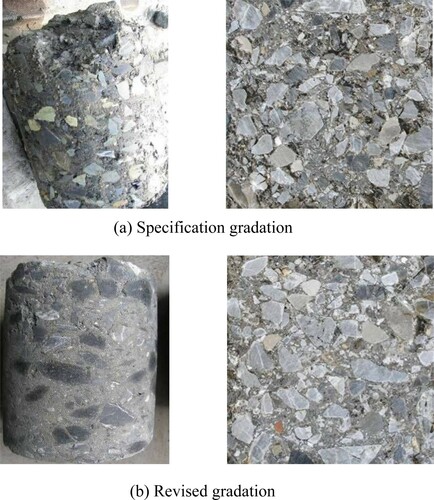
Figure 12. Base course cores. (a) Specification gradation. (b) Revised gradation.