Figures & data
Figure 1. Schematic representation of TSD tests of asphalt pavements.
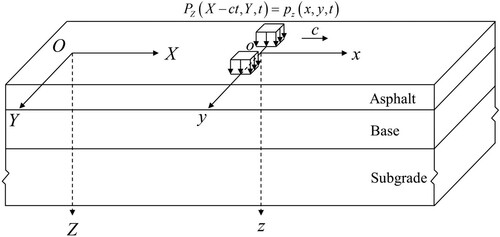
Figure 2. Schematic representation of the 2S2P1D model.
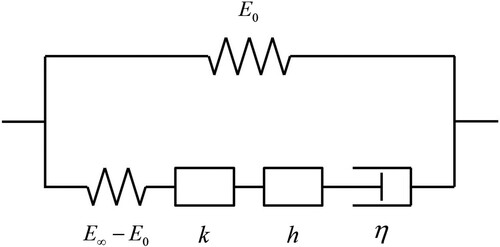
Figure 3. Simulated TSD loading configuration.
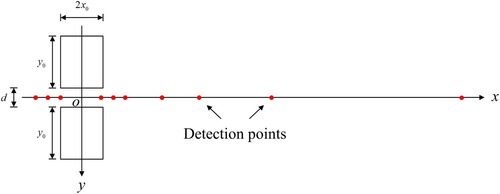
Table 1. Structural parameters of the asphalt pavement.
Figure 4. Simulated complex Young’s modulus versus frequency: (a) absolute value, (b) phase angle.
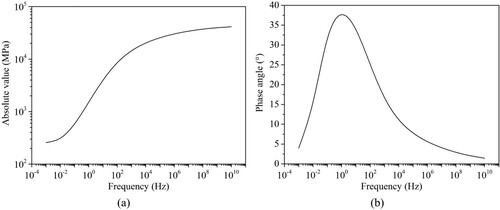
Figure 5. Comparison between the results of elastic and viscoelastic models: (a) vertical deflection curve, (b) slope curve of vertical deflection.
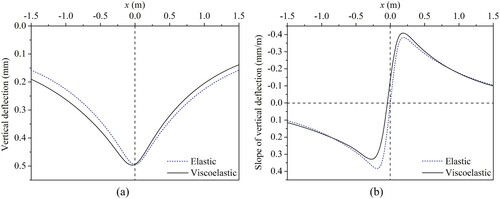
Figure 6. Contour curves of surface vertical deflection for different models: (a) elastic model, (b) viscoelastic model.
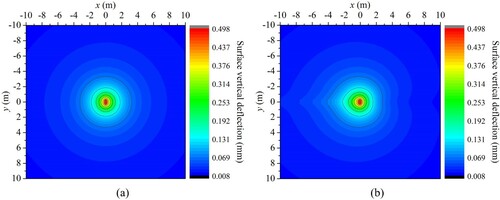
Figure 7. Comparison of vertical deflection curves calculated by different models.
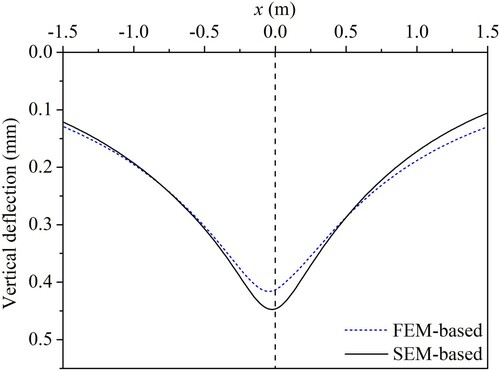
Table 2. Computational requirements for different models.
Figure 8. Sensitivity of the slope curve of vertical deflection to loading parameters: (a) magnitude of force, (b) speed of movement.
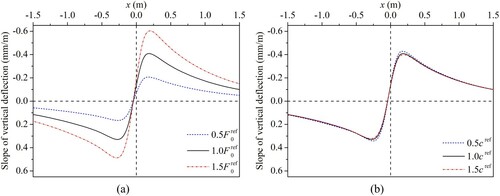
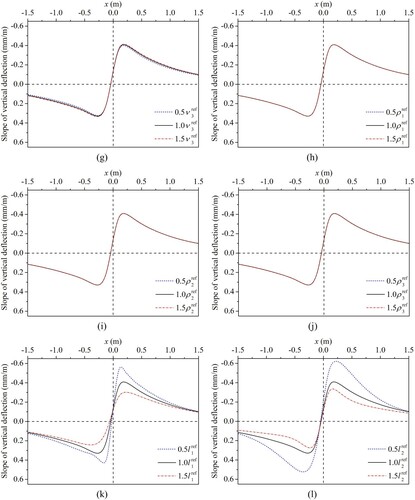
Figure 9. Sensitivity of the slope curve of vertical deflection to parameters of the 2S2P1D model: (a) static modulus, (b) glassy modulus, (c) exponent k, (d) exponent h, (e) constant ζ, (f) constant β, (g) characteristic time.
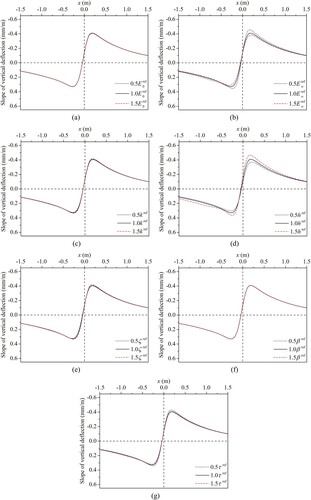
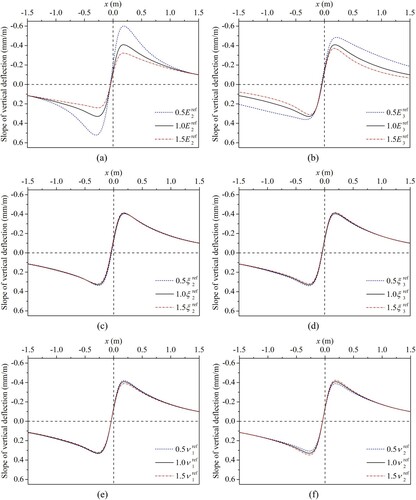
Figure 10. Continued.