Figures & data
Figure 1. (a) The microstructure, (b) the aggregates, (c) the mastic and (d) the air voids.
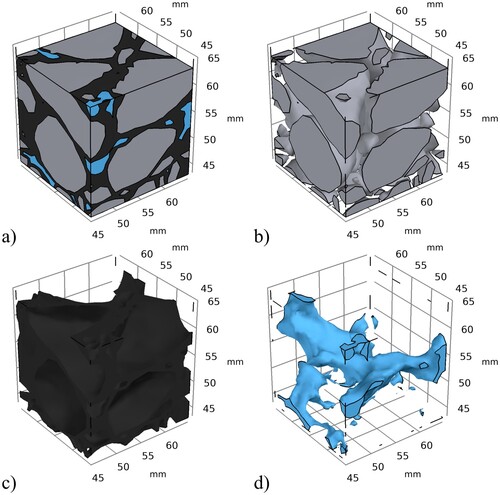
Table 1. Summary of the material properties of the components on the microscale (colour online).
Figure 2. Microscale adhesive damage after being subjected to moisture for (a) 10 days, (b) 50 days, and (c) 150 days, and cohesive damage after (d) 10 days, (e) 50 days, and (f) 150 days.
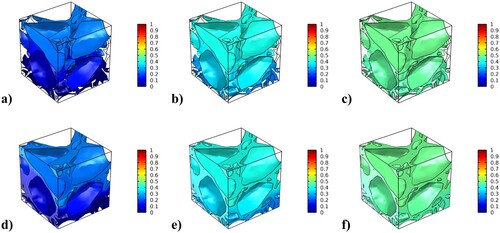
Figure 3. Effective stiffness of the microstructure after being subjected to moisture.
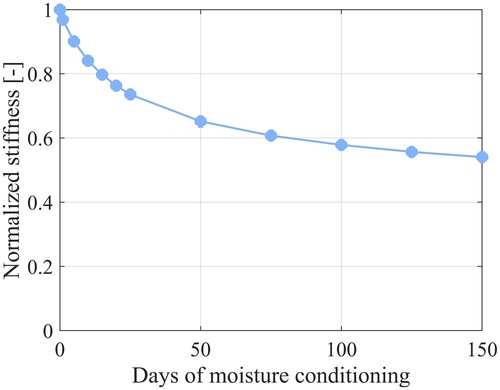
Figure 4. Comparison of the macroscale and microscale predictions of the effective moisture damage evolution.
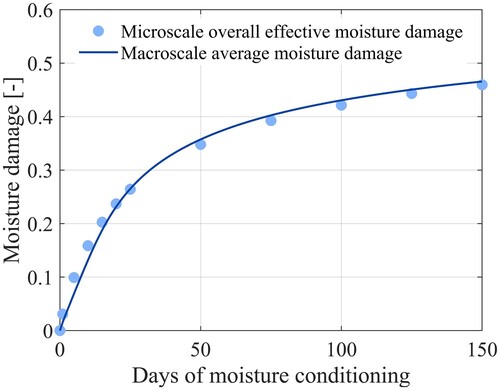
Figure 5. Microscale adhesive damage after being subjected to a creep load for (a) 1000 s (0.28 h), (b) 10,000 s (2.8 h), and (c) 16,800 s (4.7 h), and cohesive damage after (d) 1000 s (0.28 h), (e) 10,000 s (2.8 h), and (f) 16,800 s (4.7 h).
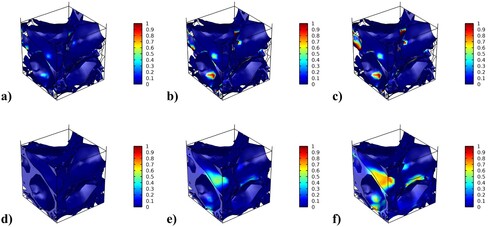
Figure 6. Effective stiffness of the microstructure during the creep test.
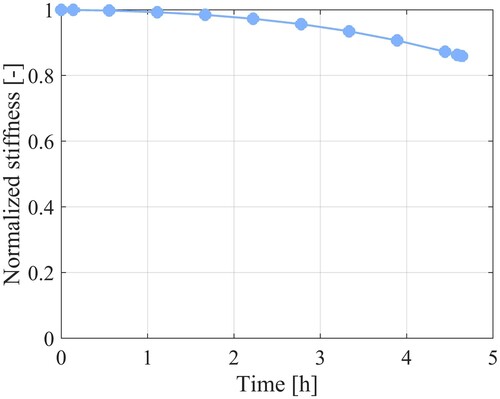
Figure 7. Comparison of the macroscale and microscale predictions of the effective elastic strain energy damage evolution.
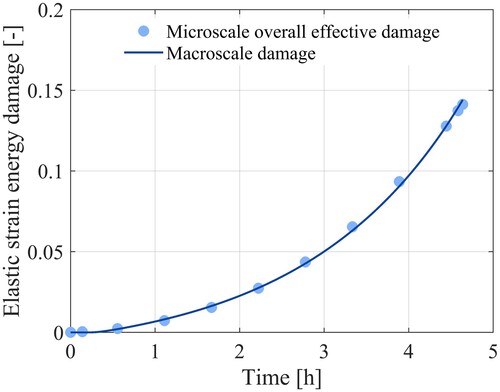
Figure 8. Microscale cohesive damage after being subjected to (a) 2 FTCs, (b) 6 FTCs and (c) 10 FTCs.
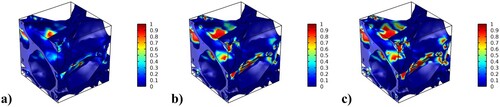
Figure 9. Effective stiffness of the microstructure after being subjected to freeze-thaw cycles.
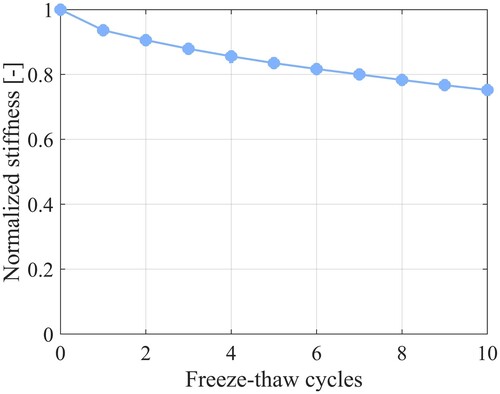
Figure 10. Comparison of the macroscale and microscale predictions of the effective FTC damage evolution.
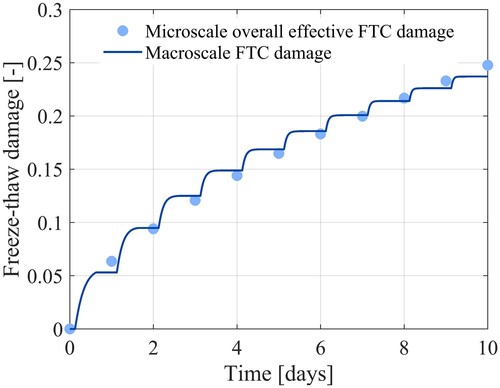
Table 2. Summary of the material properties of the components on the macroscale (colour online).
Figure 11. Damage development in Weather scenario 1 after (a) 5 days and (b) 10 days, and damage development in Weather scenario 2 after (c) 5 days and (d) 10 days.
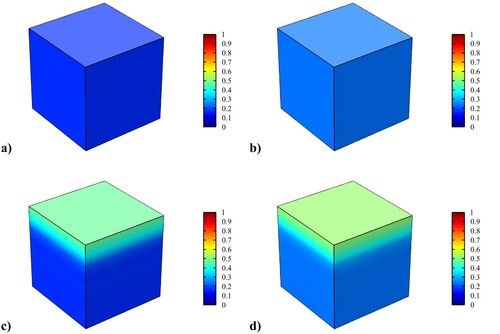
Figure 12. (a) Damage development in Weather scenario 1, (b) damage development in Weather scenario 2 and (c) overall stiffness degradation of the material in the two scenarios.
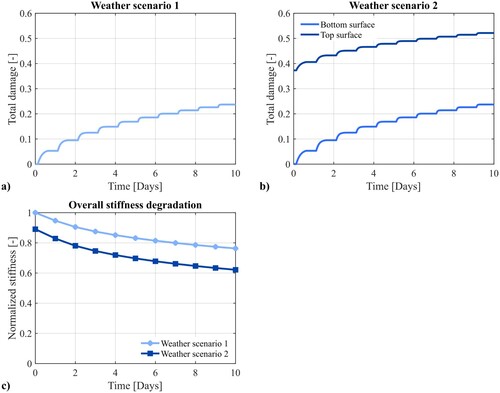
Figure 13. Damage development during the two scenarios.
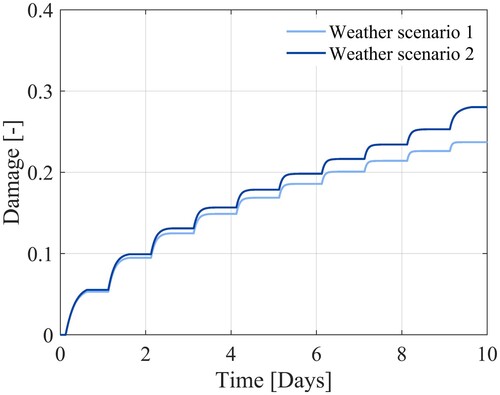
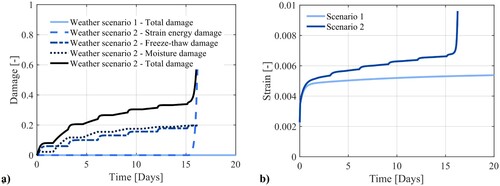
Figure 14. (a) The damage curves for both scenarios and (b) the axial strain of the pavement for both scenarios.