Figures & data
Figure 1. Proposed framework for multi-objective optimization. Legend: HFO – heavy fuel oil.
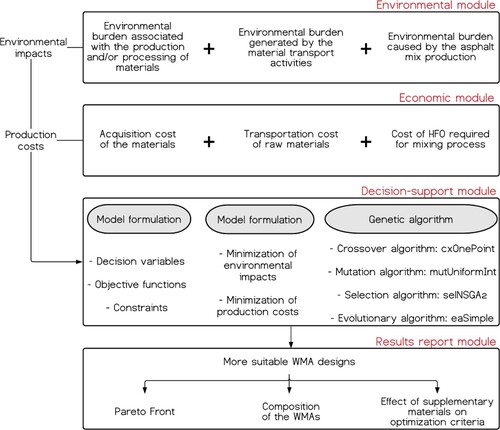
Table 1. Synthesis of investigations regarding LCA efforts on WMA.
Figure 2. Approaches proposed by the FHWA to carry out LCAs in the pavement industry.
Adapted from: (Harvey et al., Citation2016; Vega et al., Citation2019).
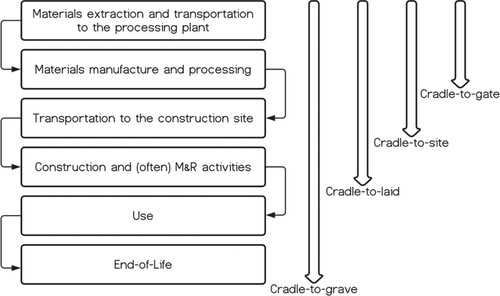
Figure 3. Boundaries contemplated for modeling the production of WMA in asphalt mixing plants. Legend: NA – natural aggregates.
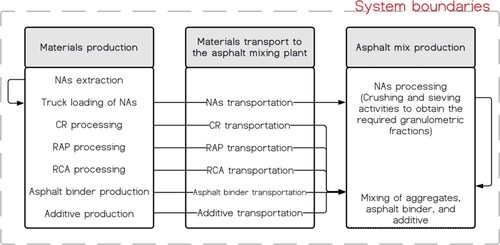
Table 2. LCI adopted for this research.
Table 3. Parameters considered to calculate TE.
Figure 4. Incidence of RAP and RCA in WMAs produced with chemical additives.
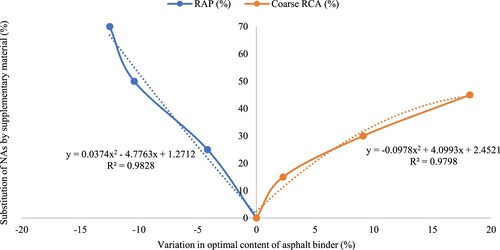
Table 4. Characterization results for the materials production stage.
Table 5. Characterization results for the for the second and third stage.
Table 6. Parameters that define Equation (2).
Table 7. Numerical factors to perform the weighting process in the BEES+ model.
Source: SimaPro 9.1.1 and (Gloria et al., Citation2007).
Table 8. Parameters that define Equation (4).
Figure 5. Optimization process through GAs proposed for this study.
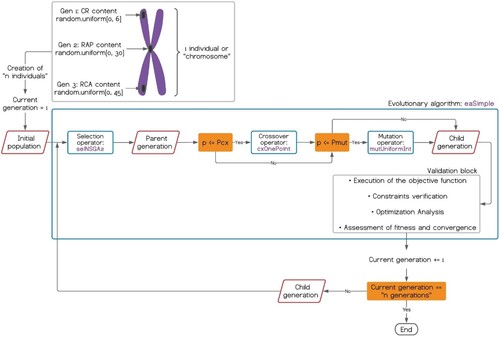
Table 9. Selected hyperparameter values to the proposed optimization process through GAs.
Table 10. Composition and characteristics of the control WMA. Taken from: (Vega, Martinez-Arguelles, et al., Citation2020; Vega, Santos, et al., Citation2020a).
Table 11. Hauling distances adopted for this study. Taken from: (Vega, Santos, et al., 2020a).
Table 12. Standard prices in the northern region of Colombia.
Figure 6. Pareto front obtained for the case study.
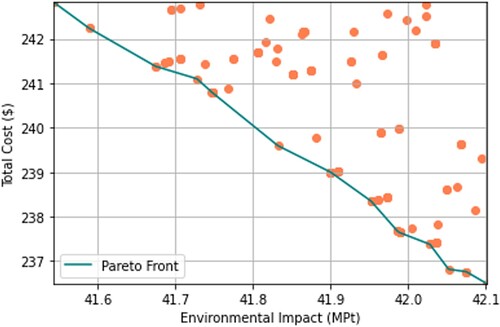
Figure 7. Percentage composition of the materials that compose two of the most suitable WMA designs. Legend: mAB – modified asphalt binder.
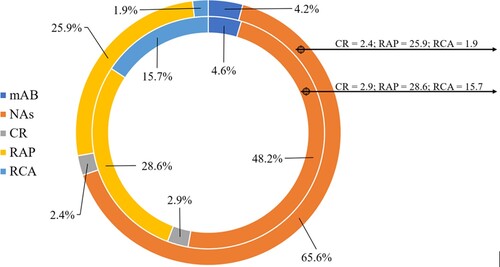
Figure 8. Ternary plot for the unitary composition of CR, RAP, and RCA in the viable mix designs.
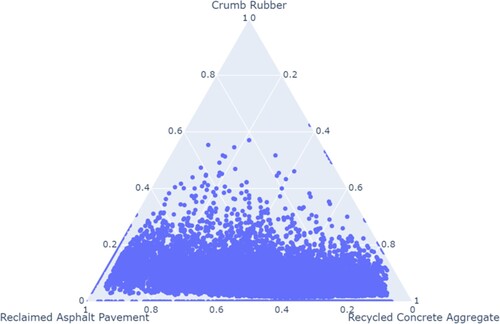
Figure 9. Effect of supplementary materials on optimization criteria.
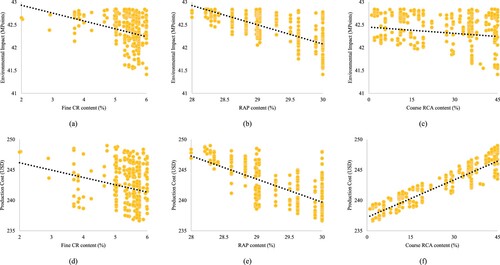
Figure 10. Optimal contents of supplementary materials considering a single IC. Acronyms: AC – acidification; EC – ecotoxicity; EU – eutrophication; GW – global warming; HA – habitat alteration; HHC – HH cancer; HHP – HH criteria air pollutants; HHN – HH noncancer; IAQ – indoor air quality; NRD – natural resource depletion; OD – ozone depletion; SM – smog; WI – water intake.
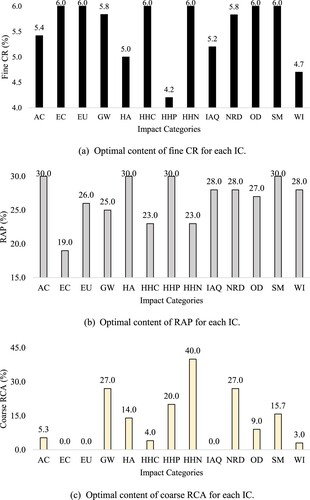
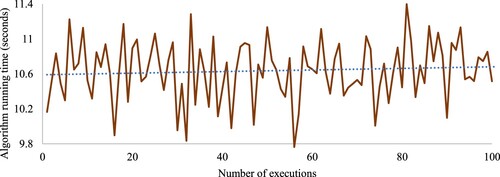
Figure 11. Record of the running time of the proposed methodology in 100 independent executions.