Figures & data
Figure 1. Illustration of rutting mechanism under channelised traffic (Dawson & Kolisoja, Citation2006)
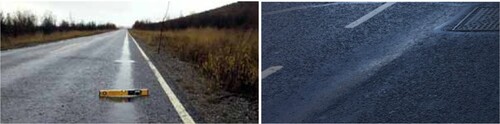
Figure 2. Location of the study area - Clearance Parade and South Parade (Ordanance Survey, Citation2019)
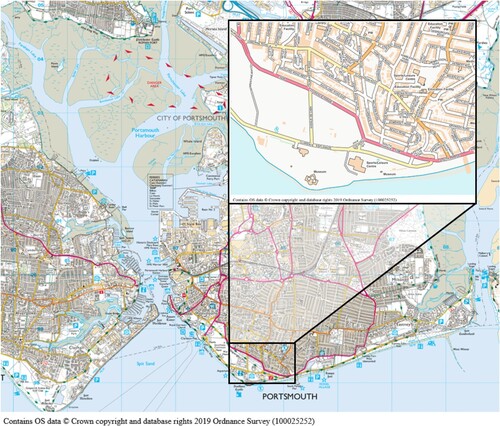
Figure 3. Superimposition method used in the analysis of recorded traffic flow
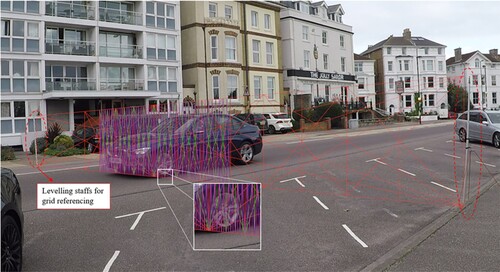
Figure 4. 100 nearside rut depths used in the analyses.
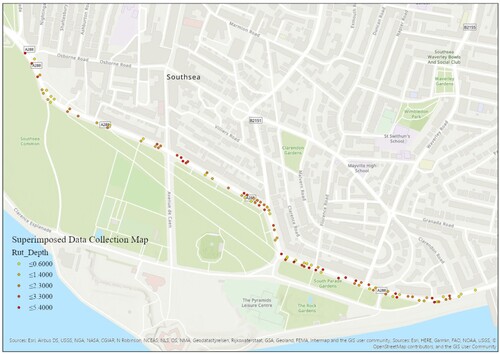
Table 1. Descriptive statistics of variables in the analysis
Figure 5. Scatter plot of the nearside wheel path rutting with the degree of channelisation
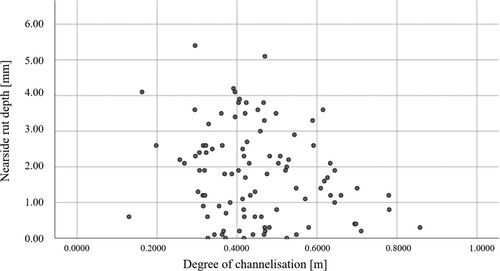
Figure 6. Boxplot of the nearside rut depth with lane
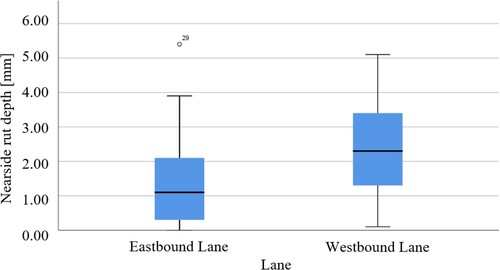
Table 2. Results of multivariate regression analysis
Figure 7. Nearside wheel path rutting deterioration model graphical representation
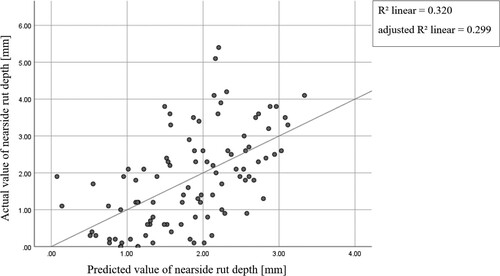
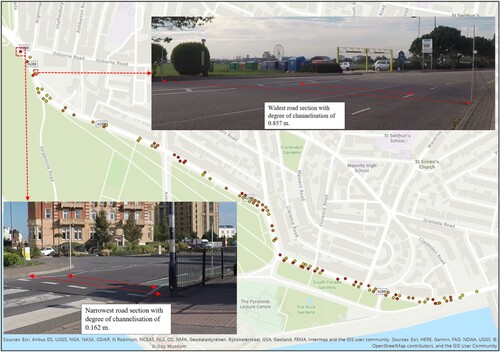
Figure 8. Illustrated map of the degree of channelisation for narrowest and widest road sections with rut depths Dawson and Kolisoja (Citation2006, Ordanance Survey (Cartographer) (Citation2019).