Figures & data
Figure 1. Illustration of the pavement instrumentation procedure (a) excavation procedure in plan-view, (b) excavation procedure in cross-section-view, (c) installation positions for the sensors, and (d) completed installation.
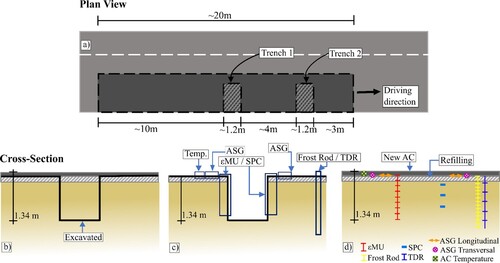
Figure 2. Pictures taken during the installation of the sensors used for the instrumentation procedure (a) ASGs – Asphalt Strain Gauges, (b) SPC – Soil Pressure Cell, and (c) ϵMU coil – Strain Measuring Unit coil.
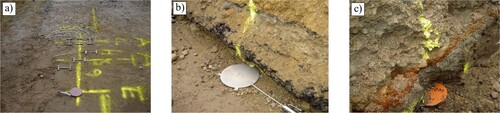
Figure 3. The layer and sensor configurations for the (a) Lv373 cross-section, and (b) Lv515 cross-section.
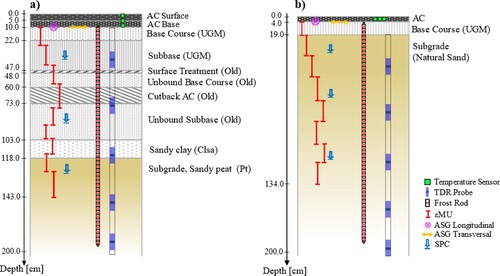
Figure 4. Recorded values at Lv373 for (a) the daily average AC temperature and (b) the moisture content variation of the unbound granular layers.
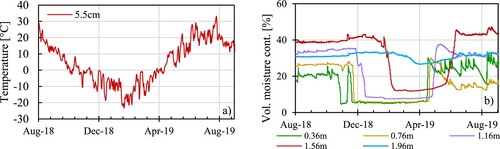
Figure 5. Recorded values at Lv515 for (a) the daily average AC temperature and (b) the moisture content variation of the unbound granular layers.
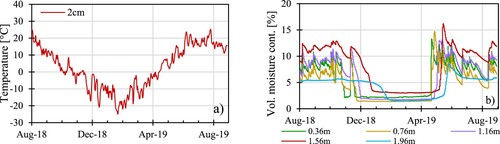
Figure 6. Cross-sectional temperature variation and frost depth corresponding to the 0°C isotherm for Lv373 from 01 October 2018 to 30 June 2019. The dotted line represents the two dates when response measurements were made.
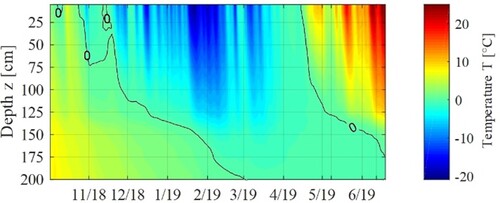
Figure 7. Cross-sectional temperature variation and frost depth corresponding to the 0°C isotherm for Lv515 from 01 October 2018 to 30 June 2019. The dotted line represents the two dates when response measurements were made.
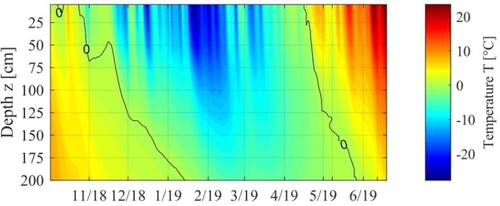
Figure 8. Flowchart illustrating the backcalculation procedure used in the study.
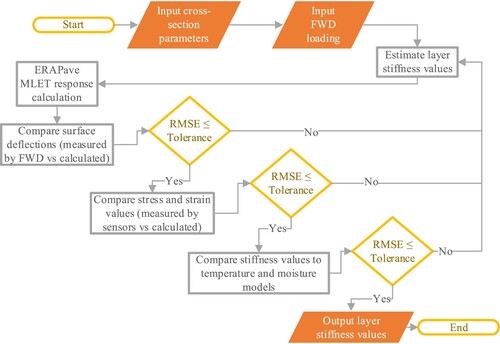
Figure 9. Deflection bowls under 50kN FWD loading compared to MLET calculations for the campaign (a) August 2018, (b) May 2019, (c) June 2019, and (d) August 2019.
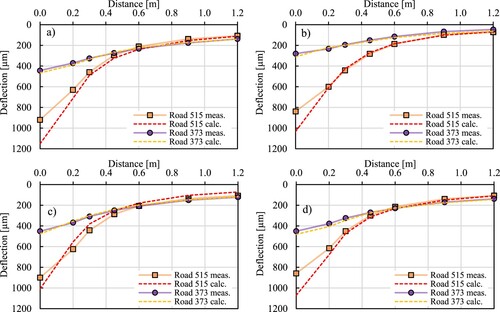
Figure 10. Adjusted values of AC stiffness according to temperature and stiffness of granular layers according to the degree of saturation.
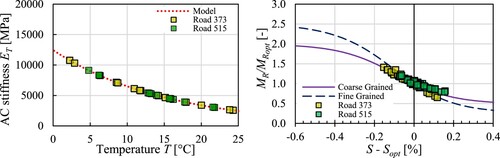
Table 1. Backcalculated stiffness values at each measurement date for Lv373. Out. and In. represent the value sets outside and inside the trench.
Table 2. Backcalculated stiffness values at each measurement date for Lv515. Out. and In. represent the value sets outside and inside the trench.
Figure 11. The LHV2 used for the response measurements. The axles are shown according to the used naming convention.
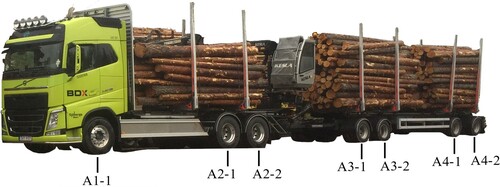
Figure 12. Half-axle and tyre configuration, spacing, and IDs for the LHVs used in this study. All distances in cm.
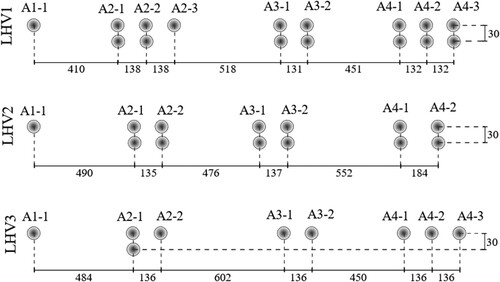
Table 3. Measured axle loads F and tyre pressures p for the three LHVs used in the study. Type S and D represent single vs. dual tyres respectively.
Figure 13. Longitudinal horizontal strain ϵxx response registrations from ASG compared to MLET calculations at Lv373 under LHV1 for (a) August 2018, (b) May 2019, (c) June 2019, and (d) August 2019.
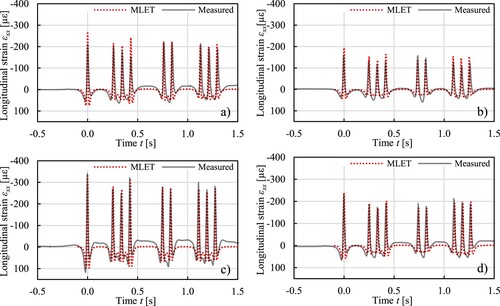
Figure 14. Transversal horizontal strain ϵyy response registrations from ASG compared to MLET calculations at Lv373 under LHV2 for (a) August 2018, (b) May 2019, (c) June 2019, and (d) August 2019.
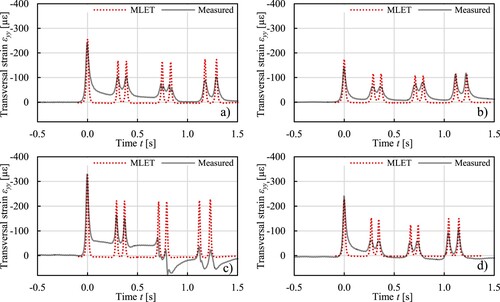
Figure 15. Vertical stress σzz response registrations from SPC at 35 cm depth compared to MLET calculations at Lv373 under LHV3 for (a) August 2018, (b) May 2019, (c) June 2019, and (d) August 2019.
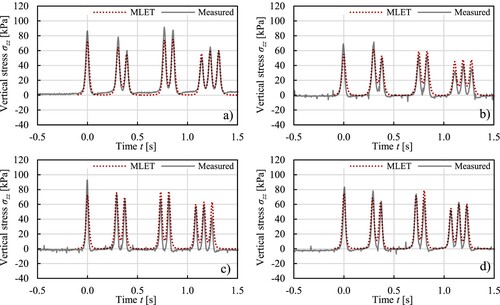
Figure 16. Longitudinal horizontal strain ϵxx response registrations from ASG compared to MLET calculations at Lv515 under LHV1 for (a) August 2018, (b) May 2019, (c) June 2019, and (d) August 2019.
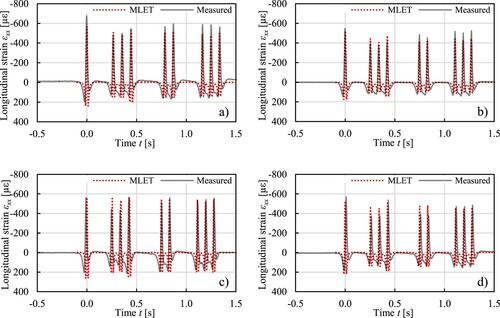
Figure 17. Transversal horizontal strain ϵyy response registrations from ASG compared to MLET calculations at Lv515 under LHV2 for (a) August 2018, (b) May 2019, (c) June 2019, and (d) August 2019.
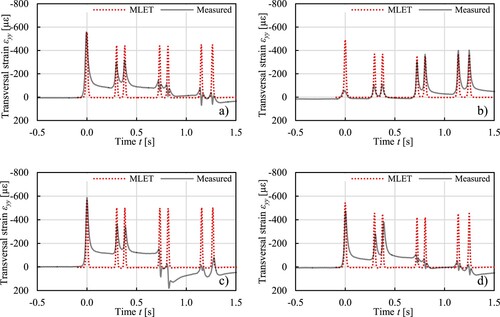
Figure 18. Vertical stress σzz response registrations from SPC at 38 cm depth compared to MLET calculations at Lv515 under LHV3 for (a) August 2018, (b) May 2019, (c) June 2019, and (d) August 2019.
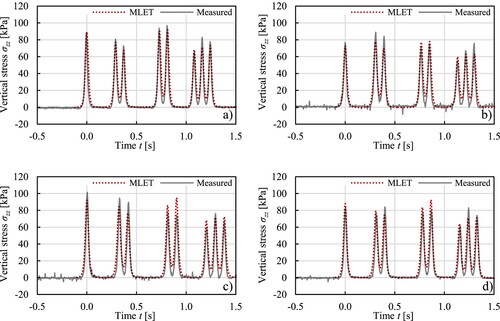
Figure 19. Vertical strain ϵzz response registrations from ϵMU coil at 84 cm depth compared to MLET calculations at Lv515 under LHV1 for (a) August 2018, (b) May 2019, (c) June 2019, and (d) August 2019.
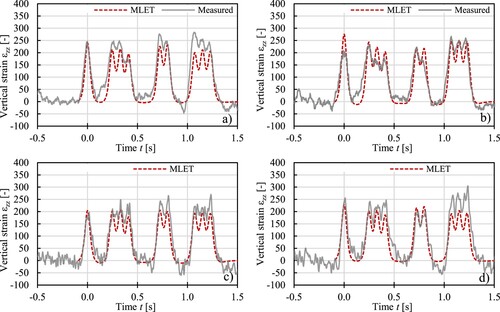
Figure 20. Comparison between measured responses, linear elastic modelling (LE), viscoelastic modelling (VE), and nonlinear k-theta modelling (k-theta) for (a) longitudinal asphalt strain gauge ASG, and (b) soil pressure cell SPC under LHV1 in measurements in August 2018.
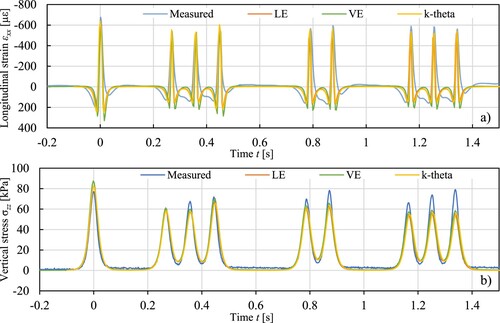
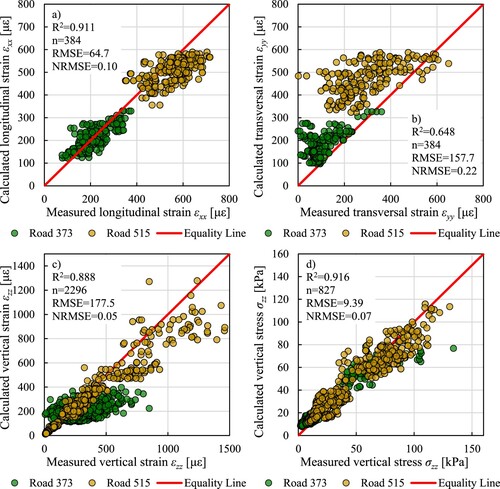
Figure 21. Validation of calculations against measurements for (a) longitudinal ASGs, (b) transversal ASGs, (c) SPCs, and (d) EMUs for all four measurements campaigns.