Figures & data
Table 1. Structure of the models (after Jelagin et al. Citation2018).
Figure 1. A bus lane in the city of Malmö: (a) section A, (b) section B with deceleration area in front of signalised intersection, and (c) section C with curb and physical barrier in the middle.
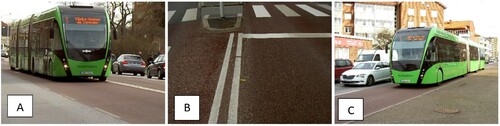
Figure 2. Pavement structures for sections A, B, and C, where gravel base and sub-base thickness are unknown.
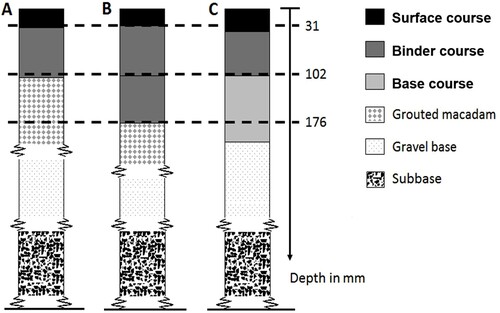
Figure 3. Average deflection data ± the measurements’ standard deviation at points from the sections’ loading centre.
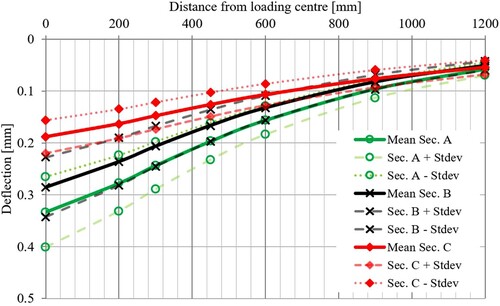
Figure 4. Average measured transverse profiles on sections A (a) and C (c) at 35 km/h, and profiles of section B (b) as a function of distance to the stop line with different speeds.
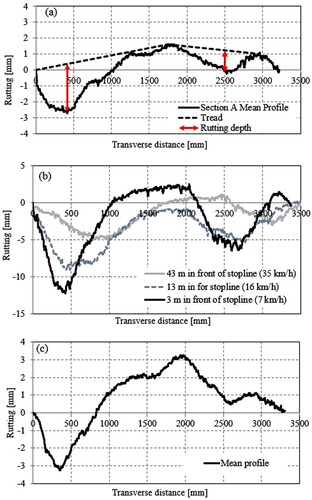
Figure 5. Phase angle and shear modulus master curves at 10 oC for surface layer mix, Viacotop 11.
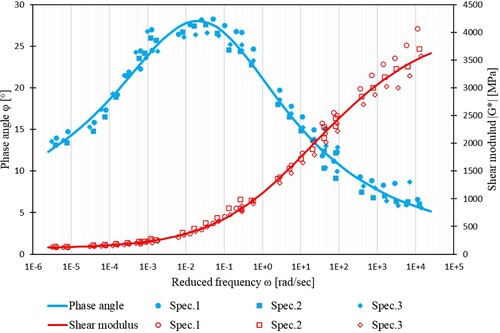
Figure 6. Phase angle and shear modulus master curves at 10 oC for binder layers mixtures of the sections A, B, and C, Vicobind 22.
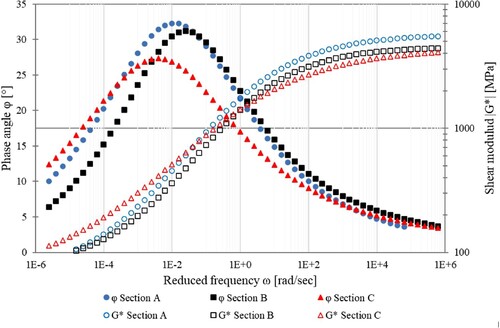
Figure 7. Phase angle and shear modulus master curves at 10 oC for base course (old base course) of the section C.
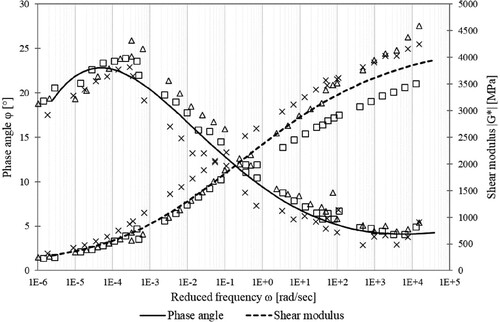
Figure 8. The viscosity of surfacing (Viacotop 11), binder layers (Viacobind 22), and base layer as a function of temperature.
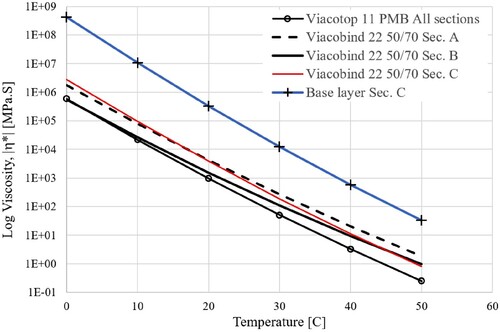
Figure 9. Hourly traffic distribution of busses 2014–2016.
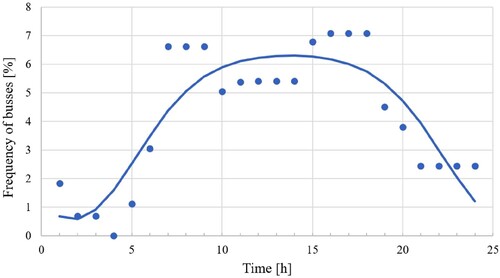
Table 2. Tire configuration on each axle and bus technical data.
Figure 10. Normal distribution of lateral wander of traffic.
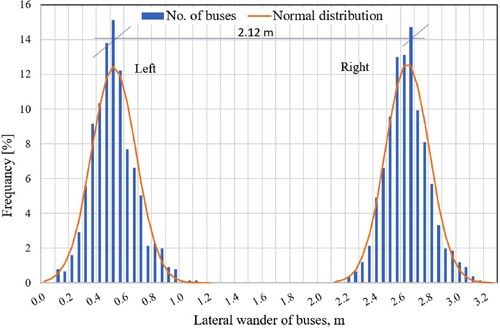
Figure 11. Monthly and hourly temperature distributions at mid of the surface layer, 0.017 m, and mid of the binder layer, 0.068 m, below the road surface.
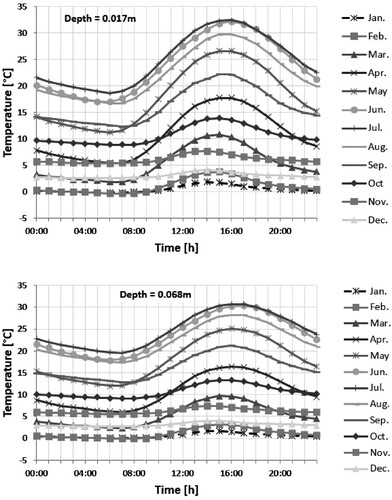
Figure 12. Relationship between measured and calculated rut depth with the coefficient of determination (R2), (a) using the default calibration factor and, (b) after the local calibration.
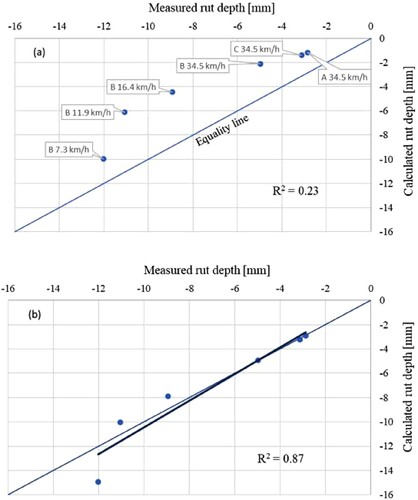
Figure 13. Measured and predicted transverse profiles for road sections A and C at a speed of 35 km/h and section B at speeds of 7, 16, and 35 km/h.
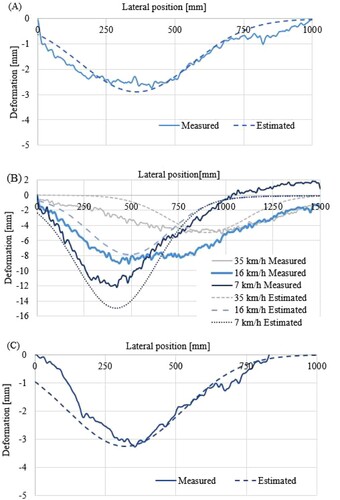
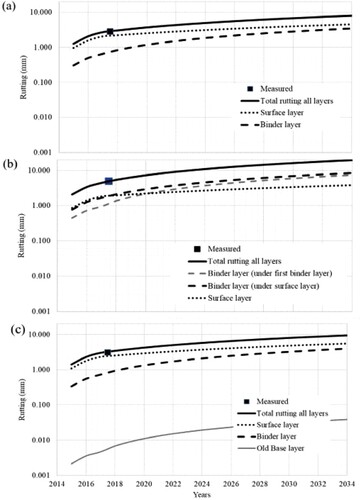
Figure 14. Measured and predicted the development of rutting for road sections A (a), B (b), and C (c).