
Figures & data
Table 1. Sources studied on the effect of adding glass particles on the subgrade behavior
Figure 1. Grain size distribution curves of the clay and recycled glass.
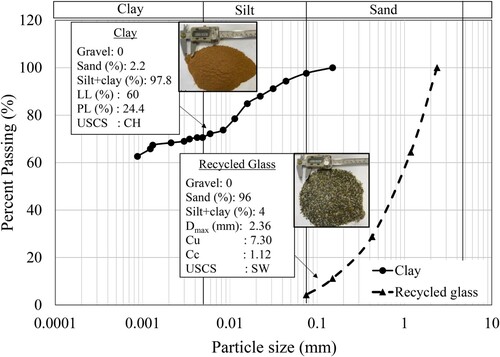
Figure 2. Modified oedometer set up used for the swell-shrink test.
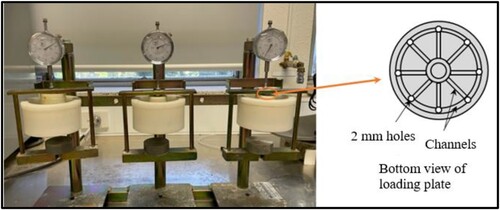
Figure 3. Moisture content vs void ratio at equilibrium according to Gould et al. (Citation2011).
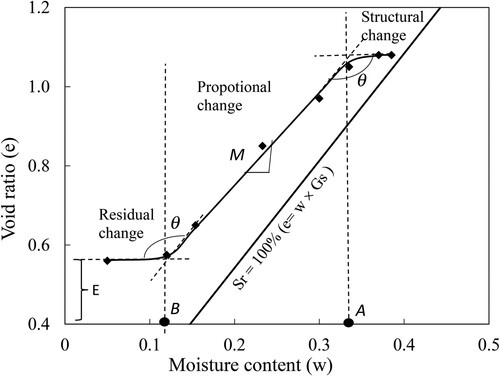
Figure 4. Compaction test results: (a) standard compaction curves, (b) effect of RG content on compaction characteristics.
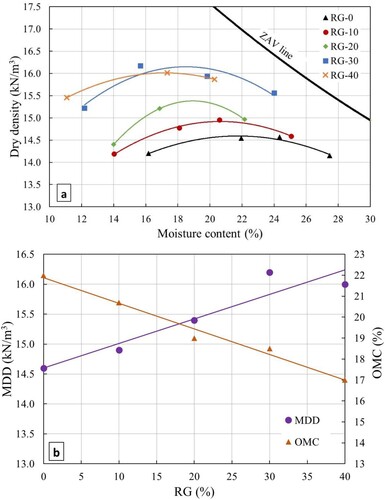
Figure 5. Effect of RG content on the consistency limits.
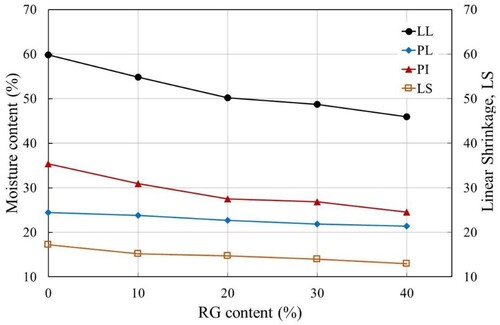
Figure 6. Oedometer test results: (a) variation of global void ratio with vertical stress (b) Cc and Cs vs RG content.
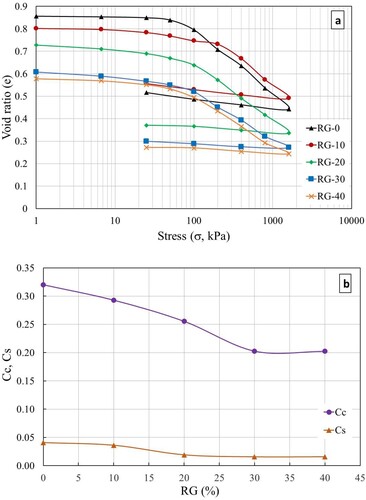
Figure 7. Effect of RG contents on the swelling potential of clay.
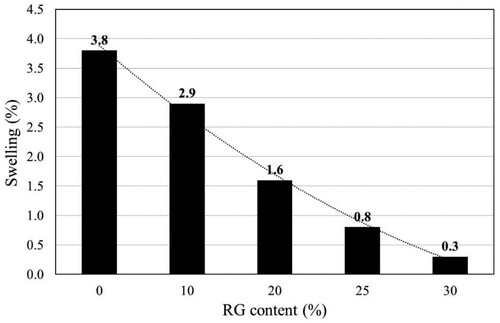
Table 2. Classification of reactive soils.
Figure 8. The UCS test results at various RG contents.
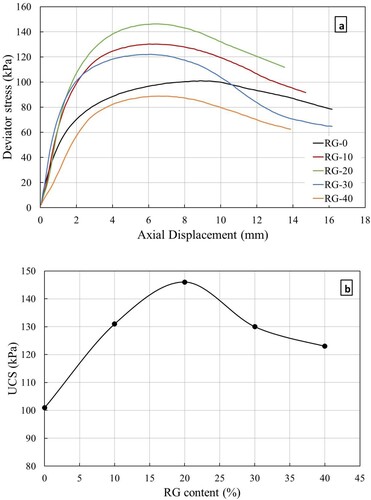
Figure 9. The CBR values at various RG contents.
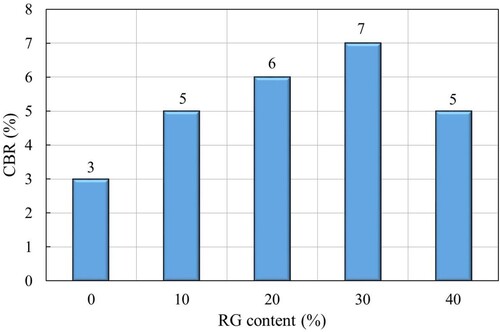
Figure 10. States of RG-stabilized clay after four cycles of shrinkage (a) RG-0 (b) RG-10 (c) RG-20 and (d) RG-25.
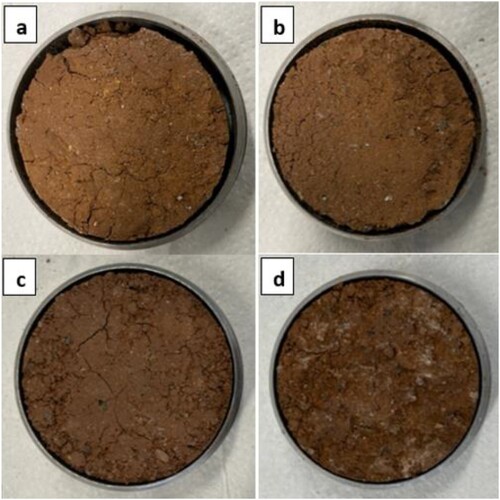
Figure 11. Vertical strains and swell–shrink cycles relationship.
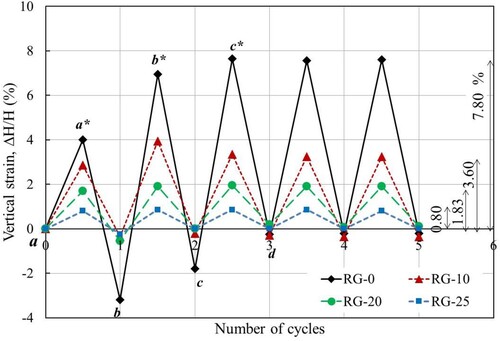
Figure 12. Variation in vertical swelling and shrinkage with swell–shrink cycles.
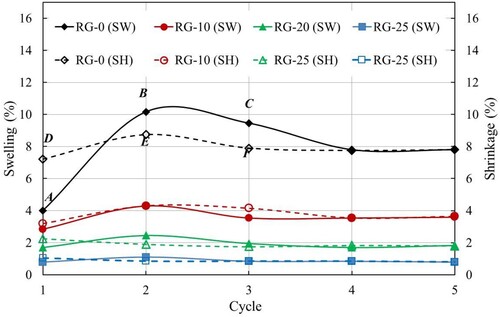
Figure 13. The void ratio – moisture content relationship at the equilibrium.
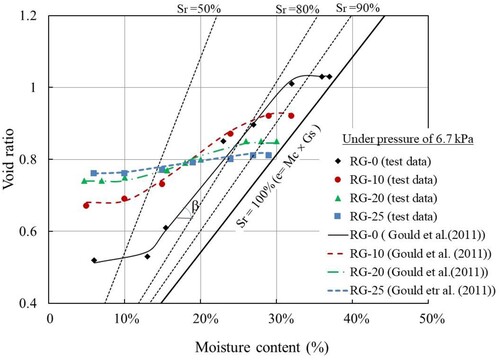
Figure 14. Effect of the RG content on the OMC and MDD of clay.
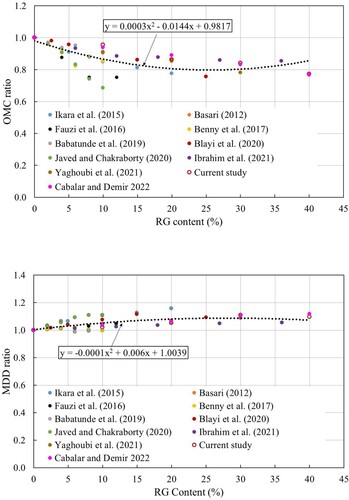
Figure 15. Effect of the RG particle size and content on LL and PI.
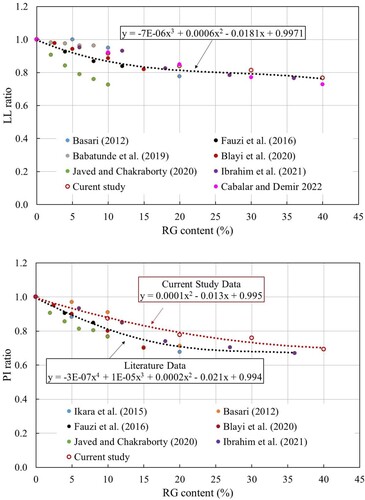
Figure 16. Effect of the RG particle size and content on UCS.
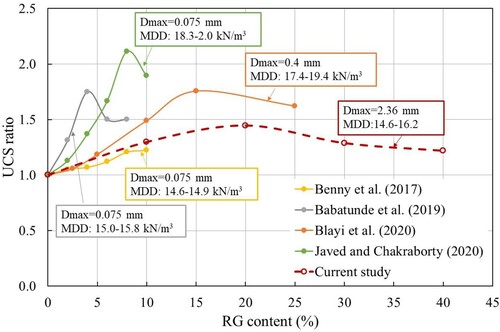
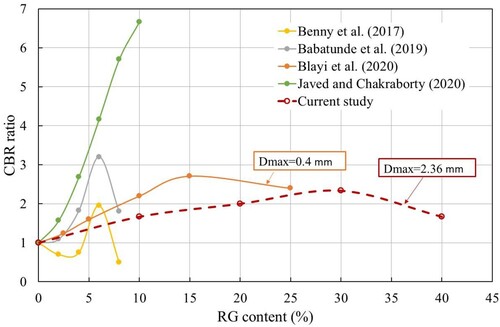
Figure 17. Effect of the RG particle size and content on CBR.
Data availability statement
All data, models, and code generated or used during the study appear in the published article.