Figures & data
Figure 1. Flowchart of the DEM modelling framework (pink particles represents fractured particles).
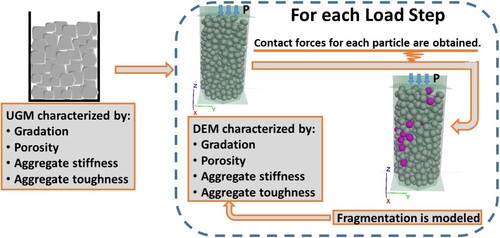
Figure 2. (a) Single size gradation model and (b) denser gradation model.
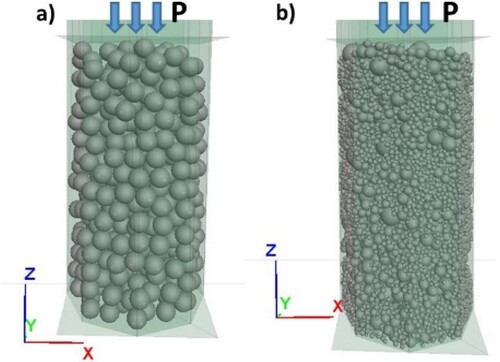
Figure 3. Illustration of two spheres in contact and variables to define contact –overlap relation.
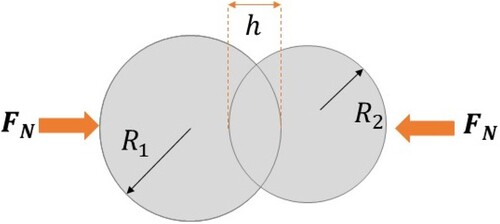
Figure 4. The force–overlap relationship.
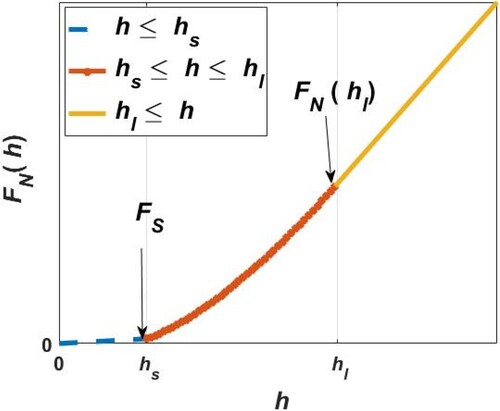
Table 1. Parameters for the UGM models measured from instrumented indentation tests.
Figure 5. Gradation curves used in experiments.
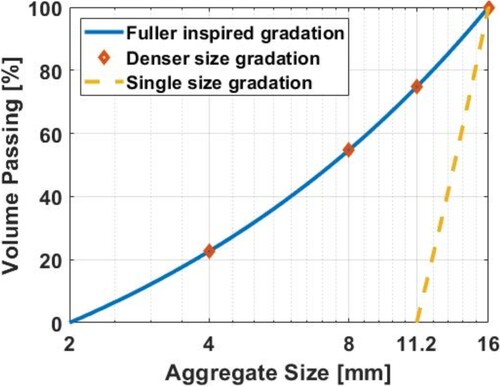
Figure 6. (a) Uniaxial monotonic compression testing setup and (b) cross-section of the cylindrical mould and the testing equipment.
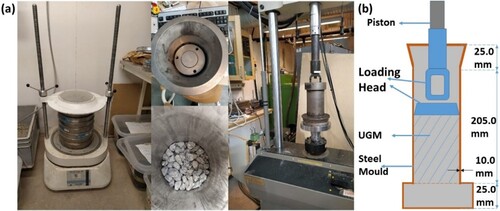
Figure 7. Definition of quantities used for the Bg-index evaluation (exemplary figure).
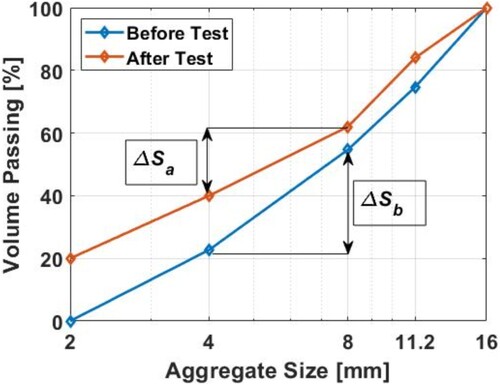
Figure 8. Loading head’s force–displacement graph for (a) single size gradation, = 20 kN and (b) denser gradation,
= 50 kN from experimental results.
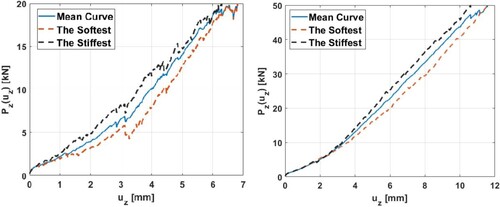
Figure 9. Measured Bg-index values.
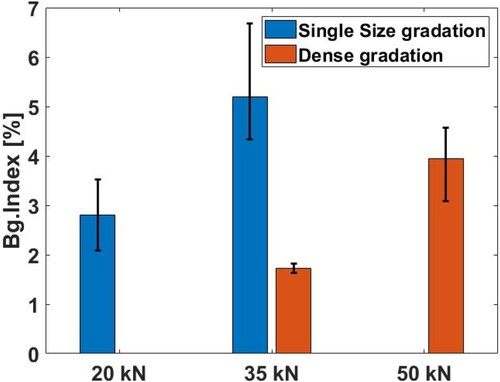
Table 2. Values used in identification of contact and damage law parameters in DEM models.
Figure 10. comparison of single size gradation simulations with different Young’s modulus.
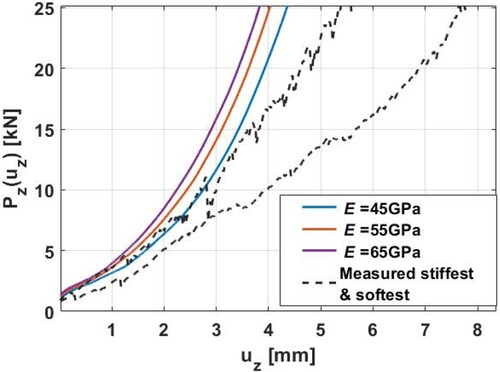
Figure 11. comparison of UGMs with (a) different
with
= 0.5 and (b) different
with
= 300 MPa.
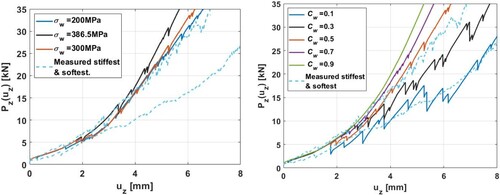
Figure 12. Bg-index comparison of UGMs with (a) different with
= 0.5 and (b) different
with
= 300 MPa.
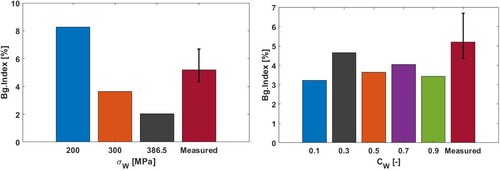
Figure 13. (a) Scatter of to each particle within the DEM models and (b) m comparison between Bg-index differences and mean Bg-index.
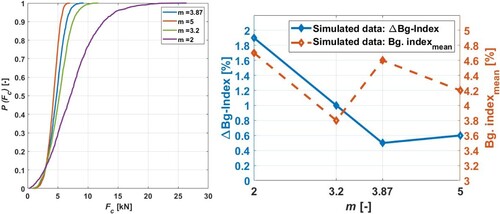
Table 3. Determined parameters of the UGM models.
Figure 14. Simulated and measured (
) curve of (a) single size gradation UGM
= 20 kN and (b) denser gradation UGM
= 50 kN.
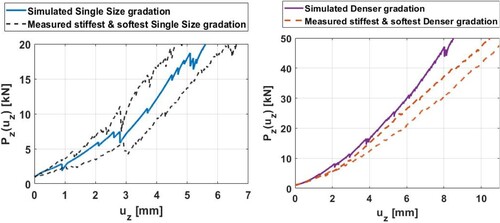
Figure 15. Bg-index from DEM simulations as a function of applied compressive load.
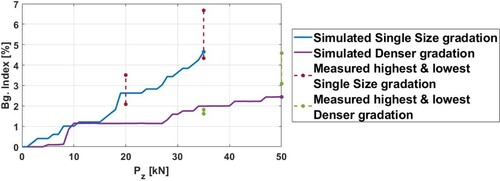
Figure 16. Distribution of fractured particles (pink) in (a) single size UGM at 35 kN and (b) densely graded UGM at 35 kN.
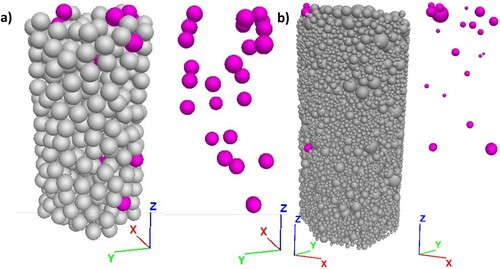
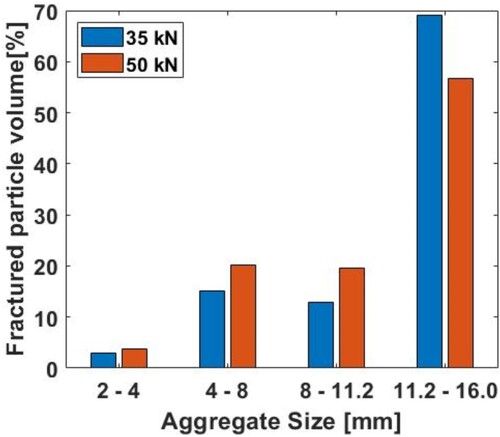
Figure 17. Broken particle volume in simulated denser gradation UGM at two load levels.