Figures & data
Figure 1. Flow chart of the research scheme.
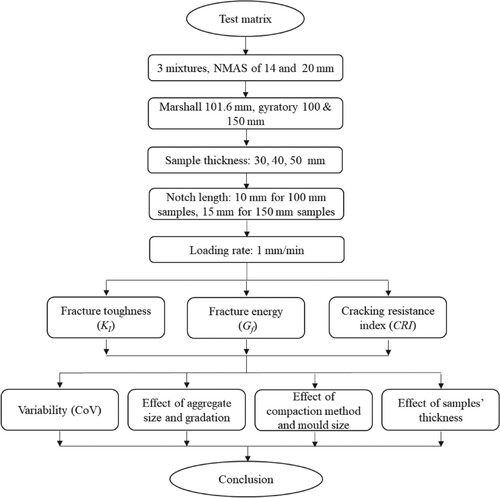
Figure 2. Gradation curves of asphalt mixtures including AC14, AC20, and SMA14.
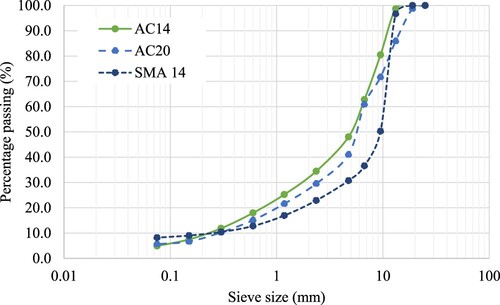
Table 1. Basic properties of the binders.
Figure 3. Sample preparation illustration for the SCB test from cylindrical compacted samples either from the gyratory compactor or Marshall compactor.
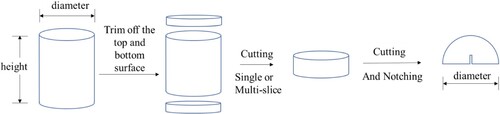
Figure 4. SCB test samples prepared in the laboratory.
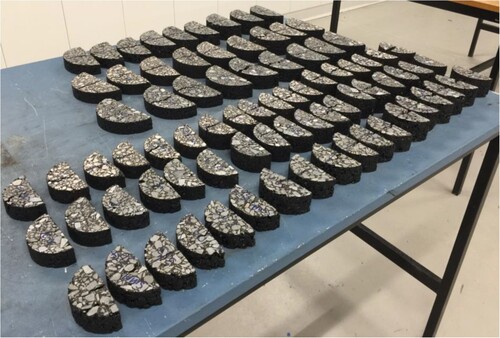
Figure 5. Testing scheme of the SCB test and sample dimension explanation: a) front view, b) side view
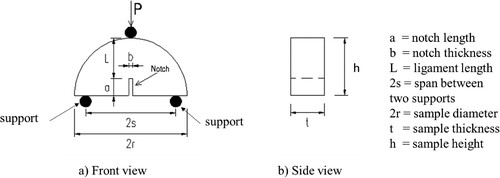
Figure 6. A typical result from the SCB test depicting the load –displacement relationship
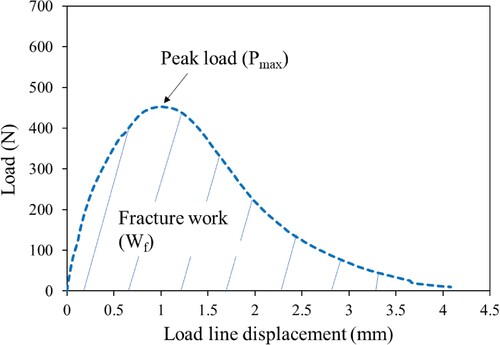
Figure 7. Typical load–displacement curves of SCB test samples of different asphalt mixes at a typical thickness of 30 mm.
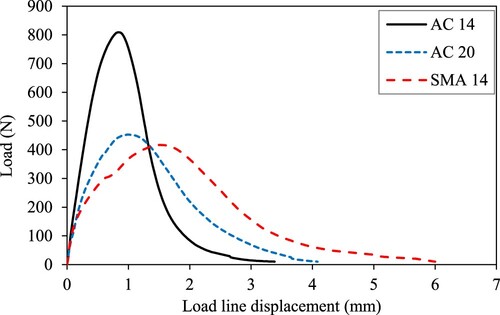
Figure 8. Typical results of SCB samples of different thicknesses.
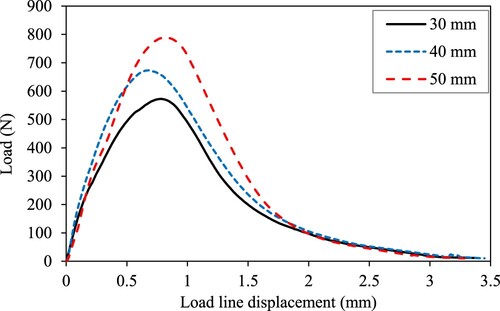
Figure 9. Typical load–displacement curves of SCB test samples of different compaction methods and diameters.
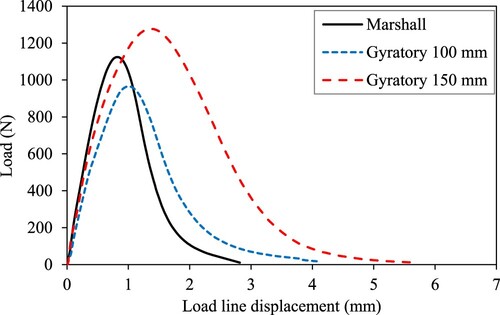
Figure 10. Repeatability of the SCB test results measured by the coefficient of variation of (a) KI, (b) Gf, and (c) CRI for three different thickness of 30, 40, and 50 mm samples.
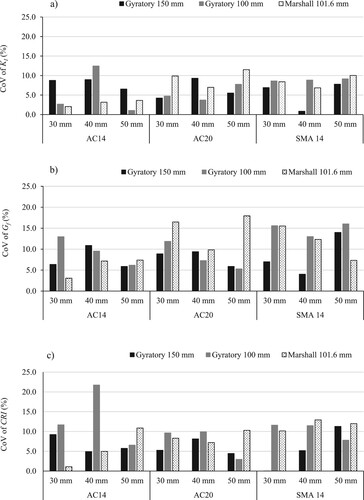
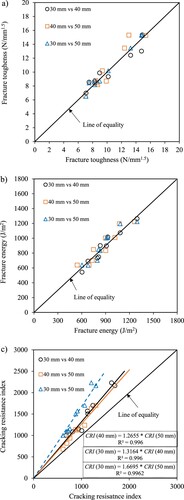
Figure 11. Compaction method and mould size analysis based on fracture toughness (a), fracture energy (b), and cracking resistance index (c).
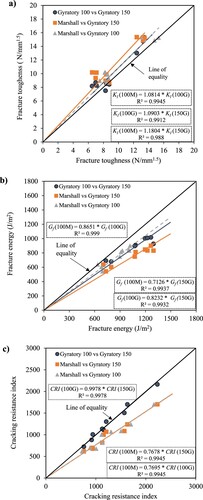
Figure 12. Thickness dependency analysis for fracture toughness (a), fracture energy (b), and cracking resistance index (c).