
Figures & data
Figure 1. Threshold analysis.
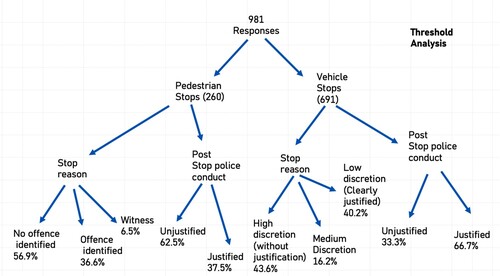
Table 1. Recoded racial appearance (vehicle stops).Footnote17
Table 2. Dichotomised racial appearance.Footnote19
Table 3. Trichotomised (targeted) racialised appearance.Footnote20
Figure 2. Proportions of vehicle intercept types experienced by racialised appearing people compared to white appearing people (uncontrolled data).
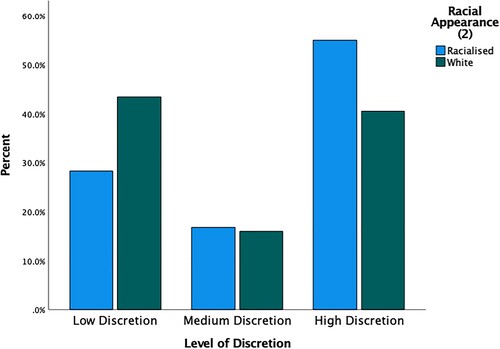
Table 4. Multinomial regression results for hypotheses 1(a–d) using vehicle stop complete cases.
Table 5. Odds ratio of stop reason and post-stop conduct for racialised and white people – pedestrian and bicycle stops (controlling for age, gender, LGBTI and disability).
Supplemental material
