Figures & data
Figure 1. A screen capture of our interface for Stable Diffusion, version 1.4.
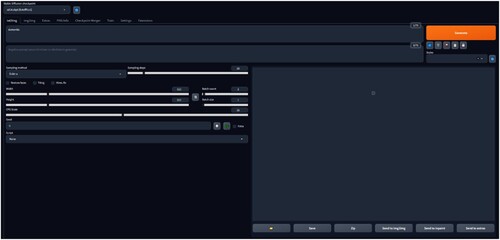
Figure 2. The results for the textual prompt “frog,” according to the number of sampling steps used*. * Sampler: Euler A, CFG scale: 15, Seed: 4193228899, Size: 512 × 512.
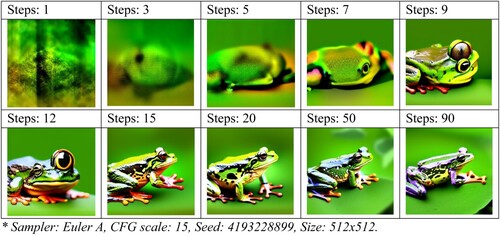
Figure 3. The first generated result for each diffusion sampler, using the same image seed*. *Seed: 3463148386, Steps: 20, CFG scale: 15, Size: 512 × 704. Diffusion samplers displayed left-right in order of appearance in the option menu.
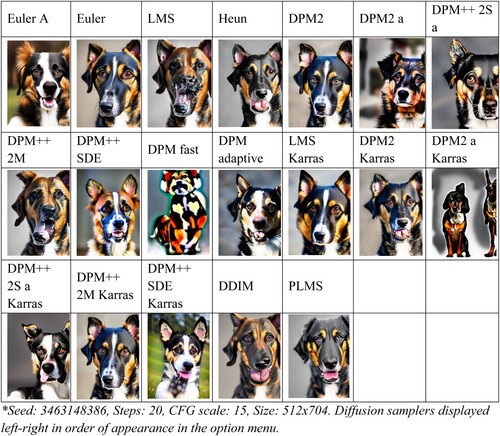
Figure 4. An example of the type of metadata saved for each generated image.
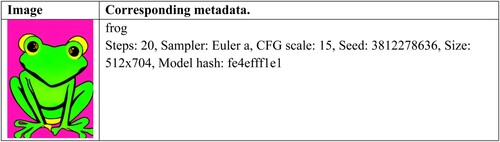
Figure 5. The individual living with dementia.
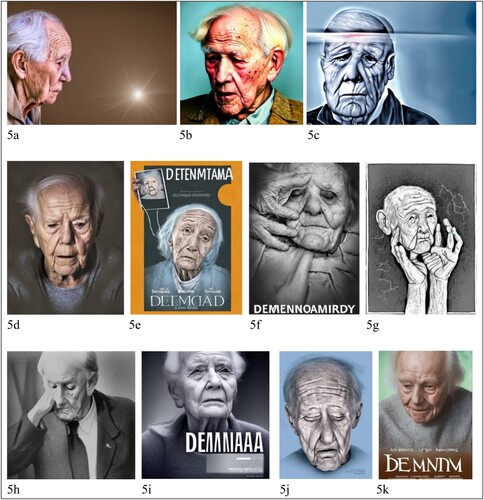
Figure 6. Variants of the “head clutcher” image for individuals living with dementia.
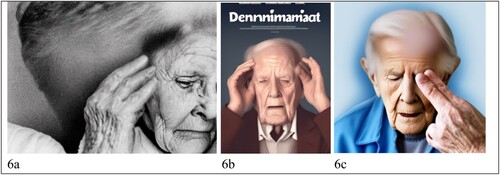
Figure 7. The brain of people with dementia.
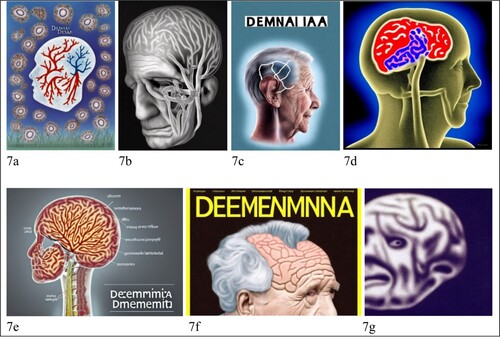
Figure 8. Cellular level visualisations of the brain of someone living with dementia.
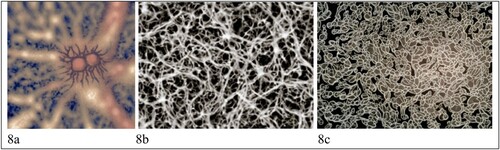
Figure 9. Metaphorical visualisations of the brain of someone living with dementia.
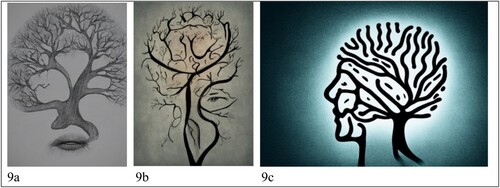
Figure 10. Images with multiple people in different visual styles.
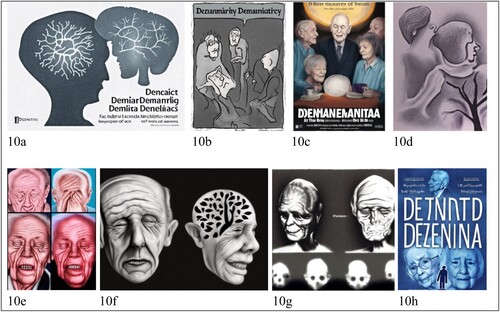
Figure 11. Interactions between people with (and without) dementia.
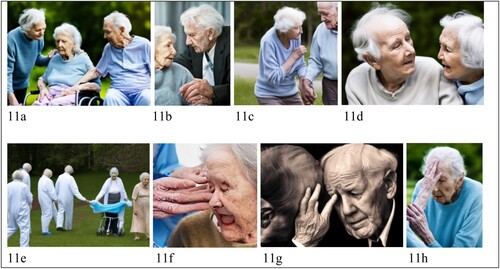
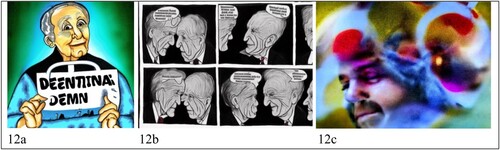
Figure 12. Three visual anomalies in the data.