Figures & data
Figure 1. Victorian General Government Sector, Payments and Receipts, % of Gross State Product, 1989/90–2022/3 (budget). Source: Department of Treasury and Finance financial data sets accessed at https://www.dtf.vic.gov.au/economic-and-financial-updates/state-financial-data-sets on 15 October 2022.
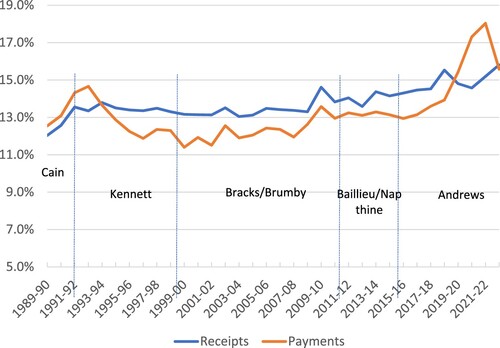
Figure 2. Victorian General Government Sector, Net Debt as % of Gross State Product, 1989/90–2022/3 (budget). Source: Department of Treasury and Finance financial data sets accessed at https://www.dtf.vic.gov.au/economic-and-financial-updates/state-financial-data-sets on 15 October 2022.
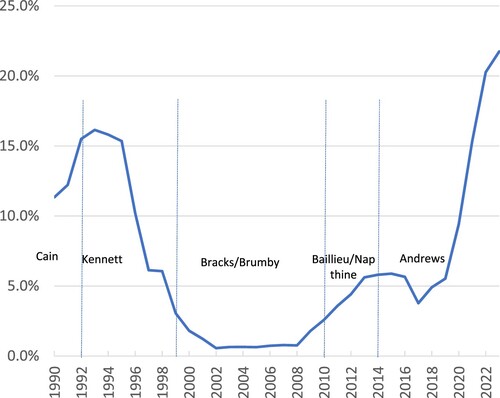
Figure 3. Victorian General Government Sector, Purchases of Non-Financial Assets as % of GSP, 1989/90–2022/3 (budget). Source: Department of Treasury and Finance financial data sets accessed at https://www.dtf.vic.gov.au/economic-and-financial-updates/state-financial-data-sets on 15 October 2022.
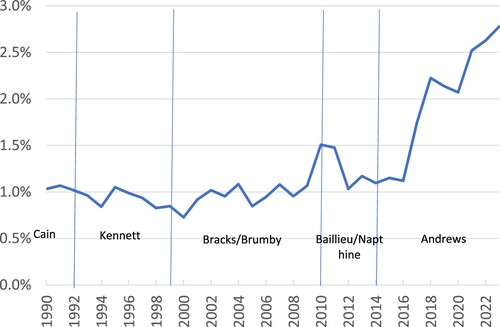
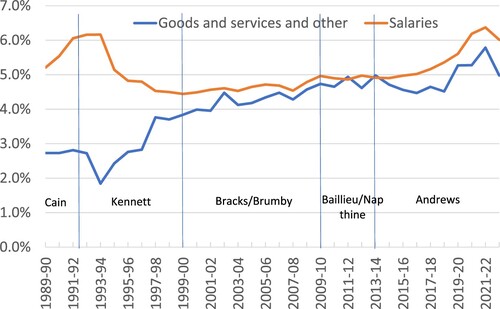
Figure 4. Victorian General Government Sector, Payments on Wages and Salaries and Payments on Goods and Services % of Gross State Product, 1989/90–2022/3 (budget). Source: Department of Treasury and Finance financial data sets accessed at https://www.dtf.vic.gov.au/economic-and-financial-updates/state-financial-data-sets on 15 October 2022.