Figures & data
FIGURE 1 The latitudinal variation of creative culture across 155 countries (based on five cross-national measures of invention and innovation detailed in Electronic Supplement 1). Midrange distance from the equator accounts for 40% of the variation in creativity (ΔR2 = .381, b = .439, n = 125, p < .001 for the northern hemisphere; ΔR2 = .345, b = .486, n = 109, p < .001 for the eastern hemisphere; ΔR2 = .293, b = .777, n = 30, p < .001 for the southern hemisphere; ΔR2 = .558, b = .542, n = 46, p < .001 for the western hemisphere). The curvilinear tendency toward the equator accounts for an additional 6% of the variation in creativity (ΔR2 = .067, b = .296, p < .001 for the northern hemisphere; ΔR2 = .057, b = .262, p < .01 for the eastern hemisphere; ΔR2 = .076, b = .361, p < .10 for the southern hemisphere; ΔR2 = .072, b = .250, p < .01 for the western hemisphere).
FIGURE 2 The ecotheory of creativity. The central hypotheses are that wealth resources strengthen the direct positive influence of stressful thermal demands of cold and heat on creative culture (H1), the direct negative influence of stressful thermal demands on parasitic diseases (H2a), and the parasite-mediated positive influence of stressful thermal demands on creative culture (indirect 2a-2b path of H2).
TABLE 1 Correlations among the predictors, the control variables, and the dependent variable of creative culture.a
TABLE 2 Effects of demands of climatic cold and heat on the prevalence of creative culture at five levels of wealth resources, based on the regression equation in the bottom-most section (155 countries). There is simultaneous support for the direct path of H1 in (sections A and B), and for the parasite-mediated 2a-2b path of H2 in (sections C and D)
FIGURE 3 Visualization of the effects of demands of climatic cold and heat on creative culture. Shown are 95%-confidence intervals of the regression coefficients for thermal demands predicting creative culture at five percentiles of wealth resources. Results are broken down for direct effects of cold (A) and heat (B), and parasite-mediated effects of cold (C) and heat (D).
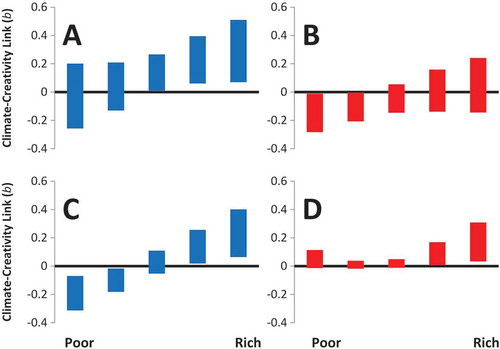
FIGURE 4 Cross-validition of the ecotheory of creativity. The explanatory power of the theory is apparent from the correspondence between predicted and measured creativity in 51 southern hemisphere countries (r = .726, p < .001).