Figures & data
Table 1. Demographic characteristics of the two groups
Table 2. ETUQ response ratings and how they aggregate into the two categories “EICTs relevant” and “EICTs used”
Table 3. Comparisons between groups of the variables EICTs relevant and used, and ability to use ET
Figure 1. Pictographs and boxplots by group of the variables “EICTs relevant”, “EICTs used” and “Ability to use ET”. Each ![]()
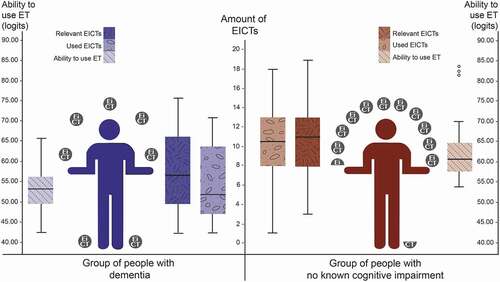
Figure 2. Frequency of responses given as ‘relevant’ to each EICT shown between the two groups and corresponding each EICT’s level of challenge, where a high logit value indicates greater challenge. Relevant is reflected by its component parts of ‘used with no difficulty or hesitation’, ‘used with any degree of difficulty’ and ‘not currently in use’
Figure 3. The remainder of EICTs for which no item calibration measure could be generated due to insufficient response frequencies for ‘relevant’ or due to a floor effect resulting from insufficient variation in the responses. Relevant is reflected as per