Figures & data
Figure 1. The information support robot, “PaPeRo” (NEC). Colors are visible in the online version of the article (Inoue et al., Citation2012); http://dx.doi.org/10.3233/TAD-120357.
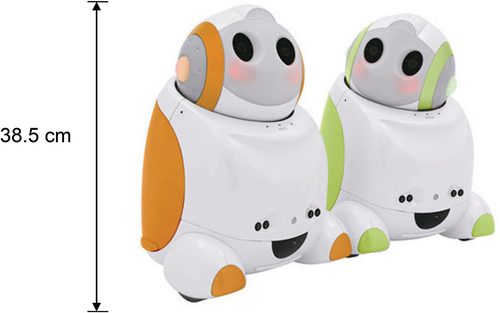
Table 1. The instruction patterns (IPs) of the robot.
Figure 2. The layout of the experiment room. The participant was always required to have a seat in front of the “PaPeRo” in order to carefully listen to what the robot talked. The experimental goods such as the medicine box and the apparatus for measuring blood pressure were placed on the table. Similarly, the jacket and the two pants were put on the bed.
Table 2. Each task was separated in several steps.
Table 3. It shows the mean of PR (%) in each task and instruction (n = 19).
Figure 3. Scatter plot for correlation between MMSE points and PR with IP1. There was a significant positive correlation in Tasks B and C, while there was no correlation in Task A.
Table 4. Summary of multiple regression analysis for variable predicting PR with IP1 for each task (n = 19).
Figure 4. It shows the scatter plot for multiple regression analysis in Task B with IP1.