
Figures & data
Table 1. Example search strategy conducted in MEDLINE.
Figure 1. PRISMA 2020 flow diagram (Page et al., Citation2021) showing the process of article identification and selection.
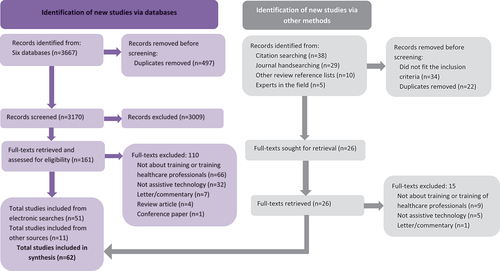
Table 2. Aims and participant demographic characteristics of the included studies.
Table 3. Methods of included studies.
Table 4. Quality scores of included studies.
Table 5. Gaps in at knowledge of health-care and social care professionals and students.
Table 6. Perceived facilitators and barriers to at training.
Table 7. Mechanisms to support effective at training.