Figures & data
Fig. 1 Examples of typical surfaces of tested transmission components (color figure available online).
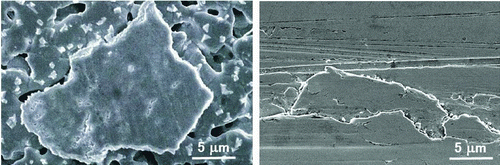
Fig. 2 Sections A and B (circled) were cut out for TEM samples using the FIB technique.
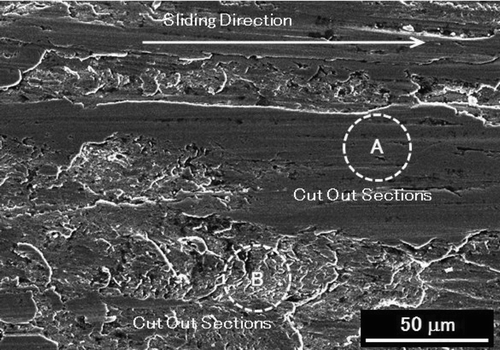
Table 1 Test Parameters
Table 2 Mechanical Properties of the Specimens
Fig. 3 Dark-field images and the corresponding ED patterns of the crystal structure below the sliding surface.
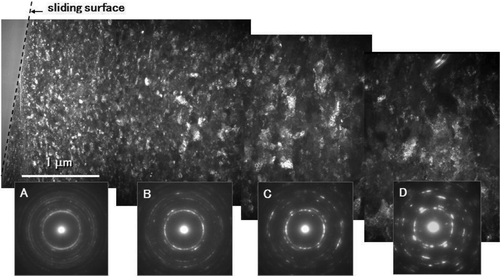
Fig. 4 Analysis of ED of (color figure available online).
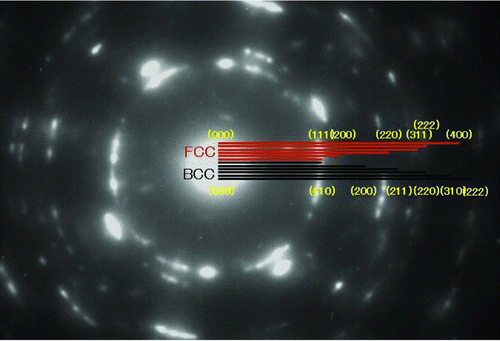
Fig. 5 Analysis of ED of (color figure available online).
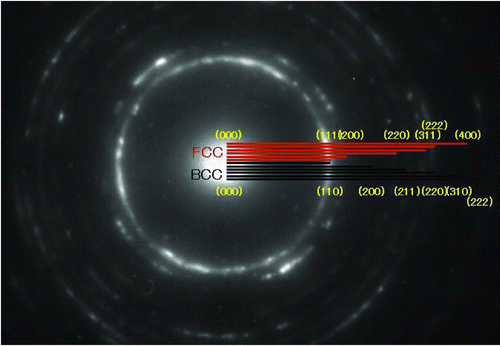
Fig. 6 Analysis of ED of (color figure available online).
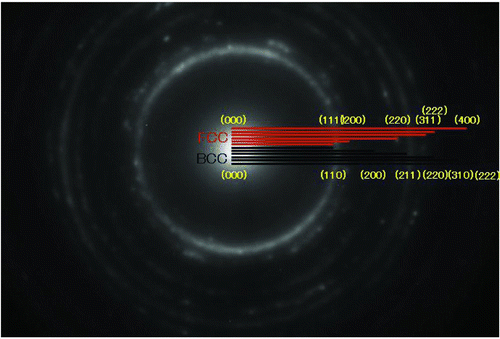
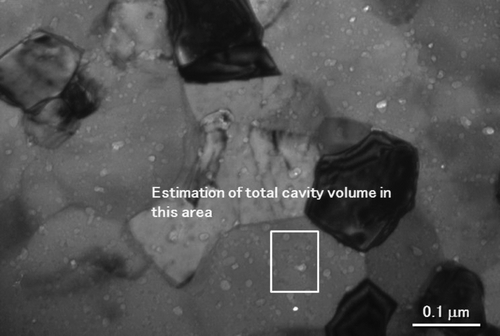
Fig. 7 Cross-sectional TEM image just under the sliding surface of section B of (color figure available online).
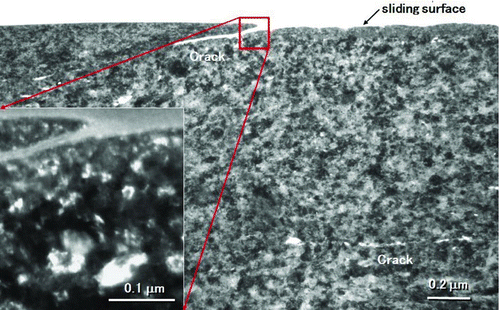
Fig. 8 Temperature change in the isochronal annealing and TEM observations.
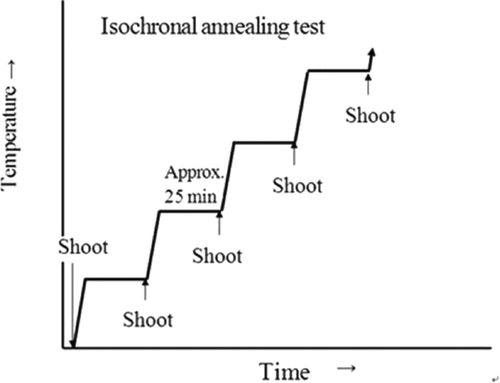
Fig. 9 Annealing of microstructure near the sliding surface.
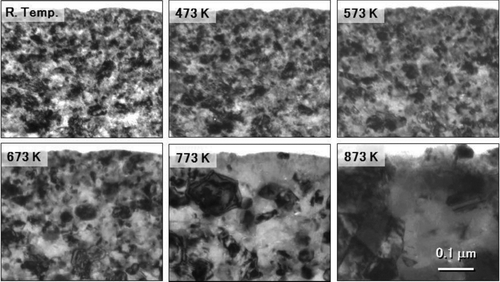
Fig. 10 ED analysis.
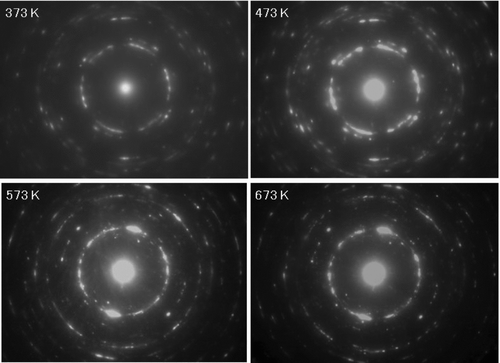
Fig. 11 TEM image of isochronal annealing at 873 K.