Figures & data
Figure 1. Schematic of the FZG back-to-back test rig: 1, test gearbox; 2, load coupling; 3, slave gearbox; 4, torque sensor; 5, motor. Source: The figure is created by Edwin86bergstedt and is not altered. The figure is licensed under the Creative Commons Attribution-Share Alike 4.0 International license, https://creativecommons.org/licenses/by-sa/4.0/deed.en
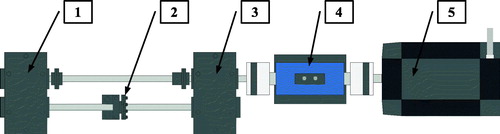
Table 1. Constants for A, B, and C in dip lubrication.
Table 2. Chemical composition of the wrought steel and powder metal materials.
Table 3. Number of gears tested and the quality class for the wrought steel and powder metal materials.
Figure 2. Overview of the in situ setup for measuring the gear flank.
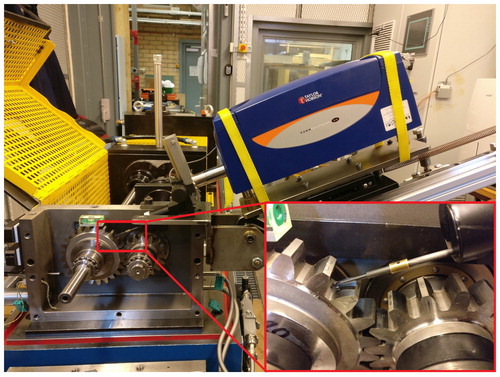
Figure 3. Gear mesh efficiency for the wrought steel (W) and PM for all speeds at three tested torque levels (61, 94, and 183 Nm).
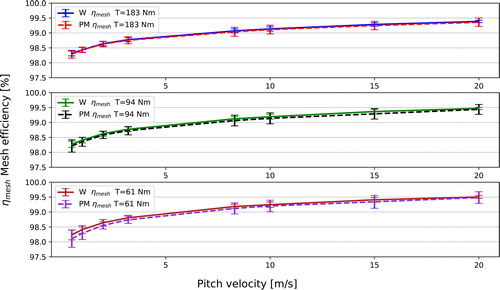
Figure 4. Gear mesh efficiency and reproducibility for wrought steel (W) and PM for all speeds at the highest torque tested (183 Nm).
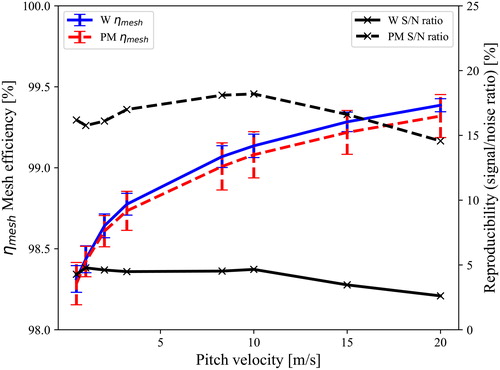
Figure 5. Gear mesh efficiency values for each speed and quality class (QC) for the wrought steel (W) with an applied torque of 183 Nm. Each cell is colored according to the corresponding value, where higher efficiency values are depicted in lighter color.
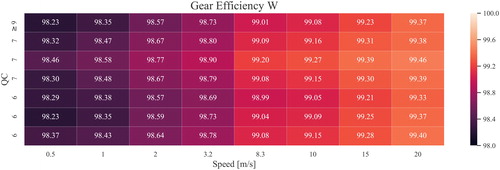
Figure 6. Gear mesh efficiency values for each speed and quality class (QC) for the PM steel with an applied torque of 183 Nm. Each cell is colored according to the corresponding value, where higher efficiency values are depicted in lighter color.
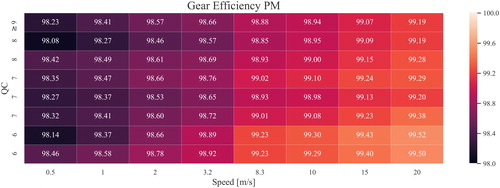
Table 4. Average Ra and Rz surface roughness parameters with corresponding standard deviation and DIN 3962 quality class of the wrought (W) steel surface before and after efficiency testing.
Table 5. Average Ra and Rz surface roughness parameters and corresponding standard deviation and DIN 3962 quality class of the PM steel surface before and after efficiency testing.
Figure 7. SEM images of representative surfaces after efficiency testing for the best and worst quality classes for both the PM and wrought steel material.
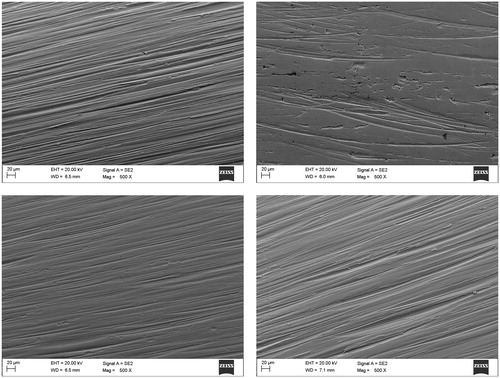
Figure 8. Abbott-Firestone bearing curves for PM with quality classes 6 and ≥9 measured after the efficiency test.
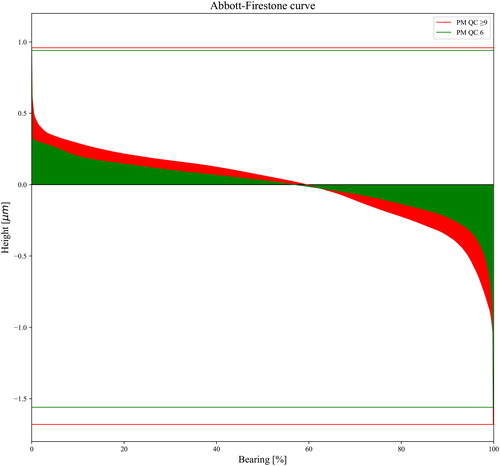
Figure 9. SEM image of PM with quality class 7; deformed asperities can be seen, as well as a region with closely packed dents forming a shallow pit.
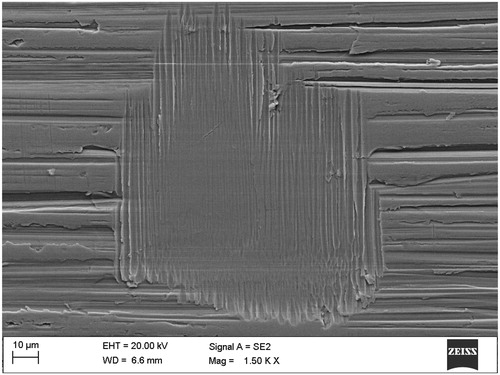
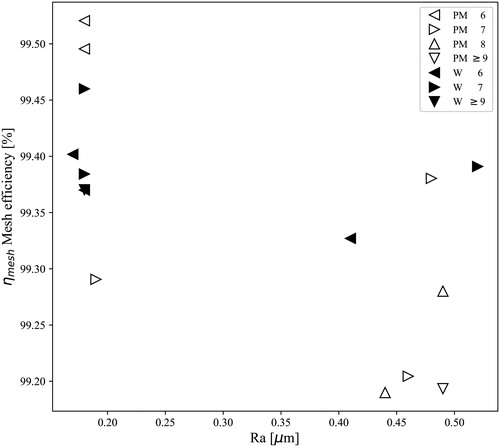
Figure 10. Gear mesh efficiency and initial Ra surface roughness for wrought steel (W) and PM at the highest torque and speed tested (183 Nm and 20 m/s).