Figures & data
Fig. 1. Schematic representation (not to scale) of static grease bleeding in a ball bearing (cross-sectional view), assuming inner ring rotation. 1: Outer ring; 2: inner ring; 3:seal; 4: grease under the cage; 5: static grease reservoir and 6: oil film
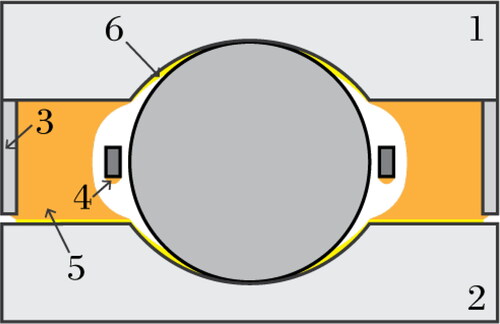
Fig. 2. a) A schematic representation of the test configuration (not to scale). b) Top-view snapshots of CaS/MS grease during bleeding. Dark circle in the center: the grease patch; solid blue lines: intensity contrast () profile of the oil stain; dashed blue lines: the effective intensity contrast profile
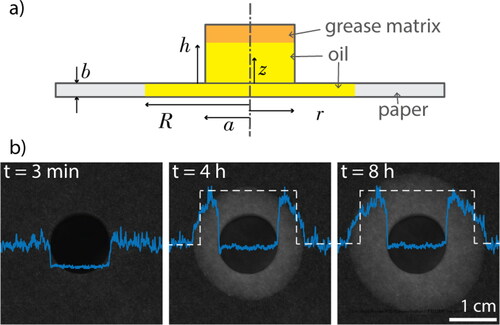
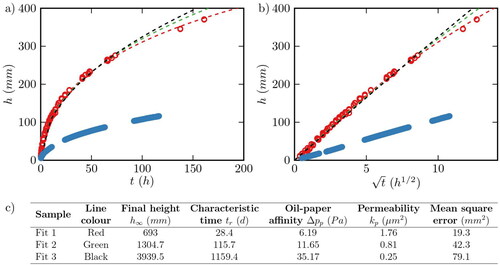
Table 1. Properties of the commercial greases and their bled oils; and the values of the fit-parameters obtained from the grease bleeding tests, the oil drop spreading tests and the initial-stage capillary rise tests.
Fig. 3. a) Effective radius of the oil stain R versus square-root of time resulting from bleeding of greases; b) normalized effective radius R/a of the oil stain as a function of normalised time
or the square-root of normalized time
(inset) collapsed onto a single master curve. The colored symbols represent the experimental data (from left to right, cyan: Li/SS; teal: Li/M; olive: PU/e; pink: LiC/PAO; and purple: CaS/M). Dashed lines represent the best fitting model curves
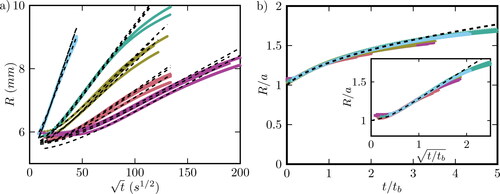
Fig. 4 a-e) Effective radius of the oil stain R versus square-root of time resulting from spreading of bled oil drops of various volume; f) normalized effective radius R/a of the oil stain versus normalised the square-root of time
or normalized time (inset) collapsed onto a single master curve. The colored symbols represent the experimental data (cyan: Li/SS; teal: Li/M; olive: PU/e; pink: LiC/PAO; and purple: CaS/M). Dashed lines represent the best fitting model curves
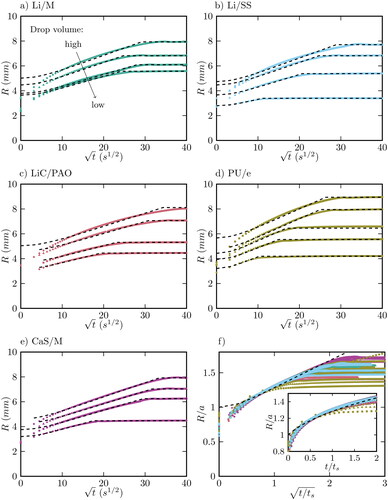
Fig. 5 a) Height of the rising front of bled oils h versus square-root of time the linear dependence confirms that the data are collected in a time range shorter than the characteristic rise time. b) h versus
Excluding the influence of bled oil viscosity η, bled oils Li/SS, Li/M and PU/e rise faster than LiC/PAO and CaS/M. Cyan: Li/SS; teal: Li/M; olive: PU/e; pink: LiC/PAO; and purple: CaS/M
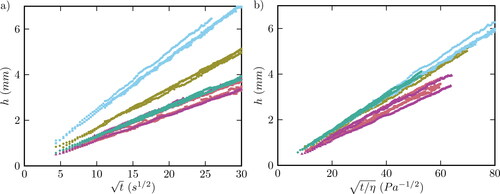
Fig. 6. a) Values of determined by the initial-stage capillary rise test (red) and by the oil spreading tests (blue); b) values of
(red), which is proportional to the absolute values of
estimated using kp = 0.16 μm2 (blue)
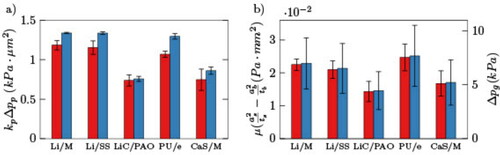
Fig. 7. Capillary rise of the bled oil of PU/e grease (blue) and that of the polyurea grease taken from (Citation31). Height of the rising front is plotted versus a) time and b)square-root of time. Scatters indicate experimental data and dashed lines are the best fits at various local minima. The fit-parameters ( and tr) and the corresponding paper properties (
and kp of the fits are given in c)