Figures & data
Figure 1. Schematic representation of the main contributors to a rolling bearing’s impedance: (a) Equivalent circuit of a rolling bearing consisting of contact capacitances. (b) Equivalent circuit of a contact capacitance consisting of the Hertzian and the outside area.
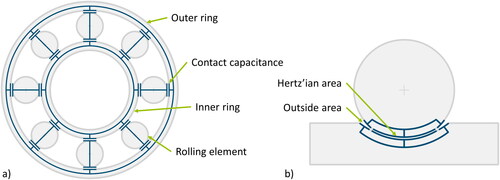
Figure 2. Schematic of the spindle with the three bearing points B1, B2, and B34 and the current/voltage flow for the impedance measurement.
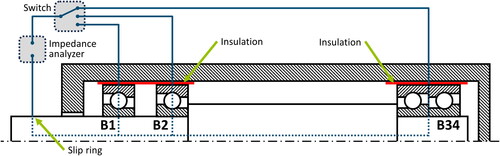
Figure 3. Test setup on the spindle with bearing points B1, B2, and B34 and the sensors.
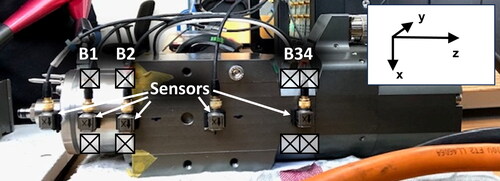
Figure 4. Time signal of the absolute impedance of bearing B2 during a free-running test at 10,000 rpm for one shaft rotation (6 ms).
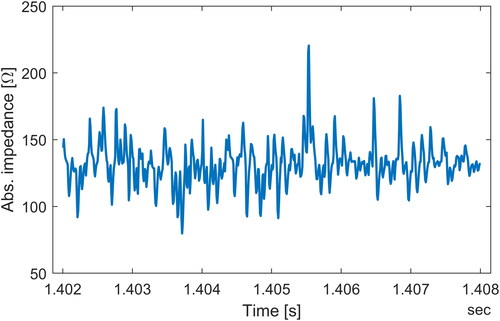
Figure 5. Comparison of different results of the impedance measurement at bearing B1 during a free-running ramp-up from 0 to 30,000 rpm.
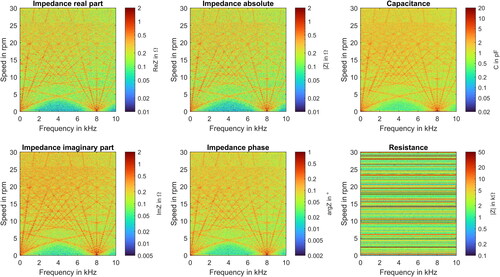
Figure 6. Waterfall diagram of bearing B1’s absolute impedance during a free-running ramp-up from 0 to 30,000 rpm.
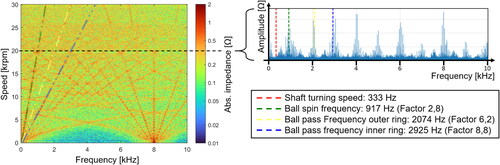
Figure 7. Highlighting of the modulation of the two line clusters in the waterfall diagram of impedance measurement at bearing B1 during ramp-up.
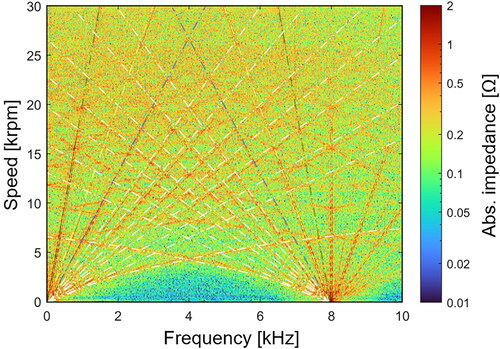
Figure 8. Comparison of the waterfall diagrams of the absolute impedance (a) and vibration measurement in x-axis (b), y-axis (c) and z-axis (d) for bearing B1 during ramp-up.
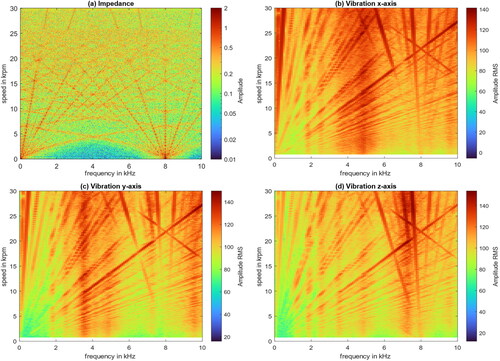
Figure 9. Change in the impedance of bearing B2 under axial load in the time domain (left) and frequency domain (right). The load was applied at second 10.
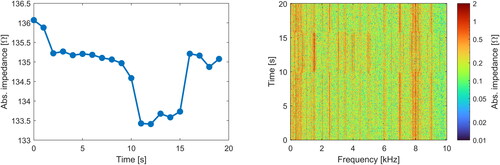
Figure 10. Detailed view of the free displacement of the impedance of bearing B2 under axial load.
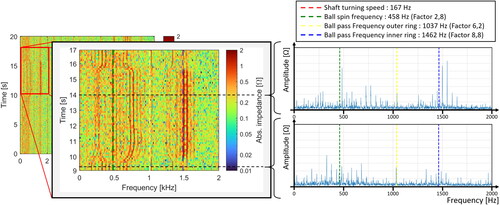
Figure 11. Change in the impedance of bearing B2 under radial load in the time domain (left) and frequency domain (right). The load was applied at second 10.
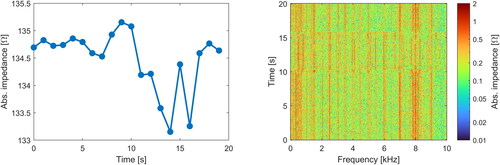
Figure 12. Concept of data processing and utilization.