Figures & data
Figure 1 Poyang Lake, China.
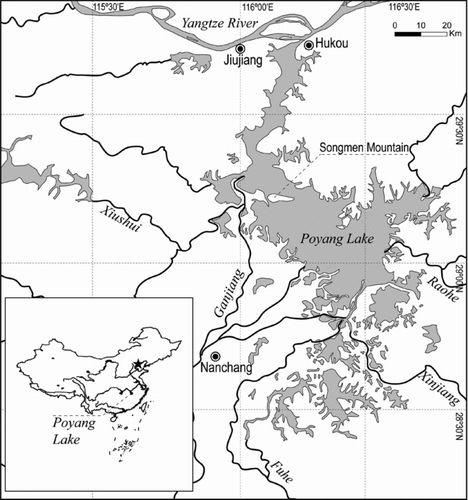
Figure 2 (A) Landsat 5 TM image (bands 4, 3, and 2) on 28 July 2011 and MODIS Terra image (band 2) on 17 October 2010 together showing the sampling sites in 2007 (black circle) and 2010 (black triangle), the defined regions describing the suspended sediment concentration in northern (N), central (C) and southern (S) regions as well as new dredging regions in central Poyang Lake (the red rectangles are dredging-related vessels identified from the band 5 of Landsat TM 5 image); (B) Photo showing the zone of turbid water caused by sand dredging (the separation line between the clear and turbid water was indicated by black arrows) (color figure available online).
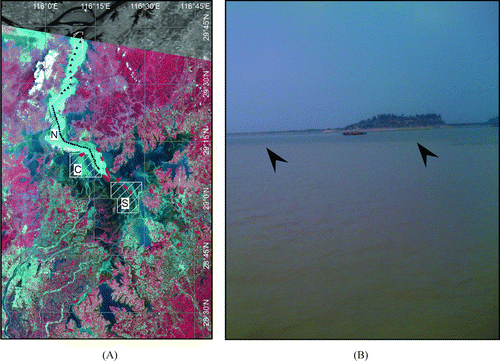
Table 1 Statistics describing the variation of suspended sediment concentrations (SSC) of 54 water samples and their corresponding red and infrared reflectance of MODIS Terra images. (Std. Dev. = standard deviation).
Figure 3 Relationships between suspended sediment concentration (SSC) and red (A: exponential model) and infrared (B: quadratic model) band reflectance of MODIS Terra images (n = 54).
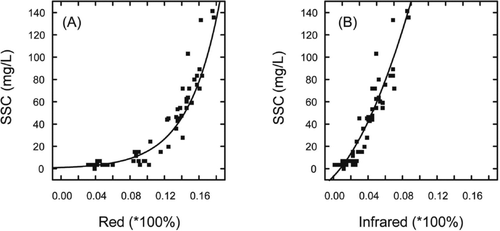
Table 2 Regression models with goodness of fit between suspended sediment concentration (SSC) and red (R) and infrared (IR) band reflectance of MODIS Terra (n = 54) and Aqua (n = 42) images (p < 0.05).
Table 3 Statistics of 54 exponential models of the Terra red band (Red) for validating the best-fitting model of suspended sediment concentration (SSC) estimation using the leave-one-out cross-validation (LOOCV) technique (SSC = a*eb*Red). (Std. Dev. = standard deviation).
Figure 4 Validation of the best-fitting regression model for estimating suspended sediment concentration (SSC) from MODIS Terra images: (A) measured vs. estimated SSCs with observed regression line (solid line) and 95% prediction interval (dashed lines); (B) residual of SSC vs. estimated SSC.
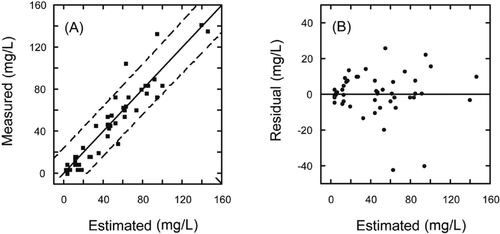
Figure 5 MODIS-based suspended sediment concentrations on 1 Aug 2000 (left, before dredging), 17 Aug 2005 (middle, during dredging), and 19 Aug 2008 (right, dredging was banned) in Poyang Lake (color figure available online).
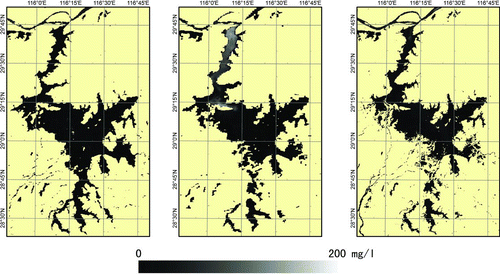
Figure 6 Mean suspended sediment concentration (SSC) within the 3 sampling regions in the northern, central, and southern Poyang Lake from 2000 to 2010 (color figure available online).
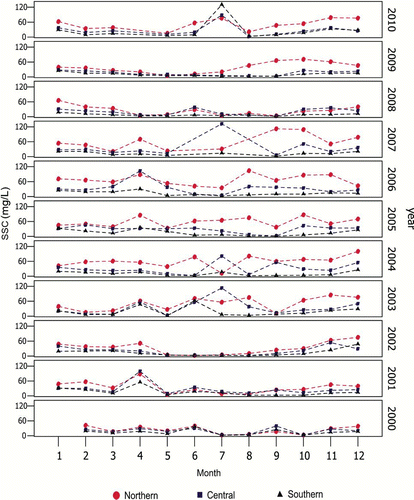
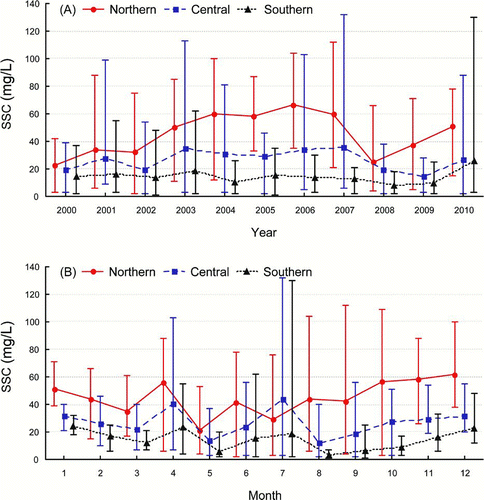
Figure 7 Yearly (A) and monthly (B) mean suspended sediment concentration (SSC) within the 3 sampling regions in the northern, central and southern Lake from 2000 to 2010. The middle point of the box-and-whisker plot is the mean value low and high whiskers are minimum and maximum, respectively (color figure available online).