Figures & data
![Figure 1 NLA lakes sampled in 2007, showing (A) 9 aggregated ecoregions and (B) multivariate classification of sample lake types used to screen least-disturbed lakes (see Table 1). Three major geoclimatic regions were defined as the Eastern Highlands (NAP + SAP), the Coastal Plains and Lowlands (CPL + NPL + SPL + TPL + UMW), and the West (WMT + XER).](/cms/asset/e9826f49-119f-4869-be52-5e0df816c369/ulrm_a_906524_f0001_c.jpg)
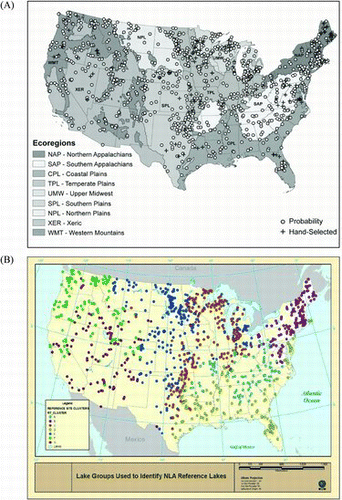
Table 1 Multivariate classification of lakes within 3 major ecoregions used in deriving expectations for littoral habitat characteristics in least-disturbed lakes of the NLA. The aggregated Omernik ecoregions are shown in A; multivariate cluster classification of sample lakes is shown in .
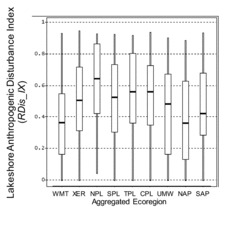
Table 2 Number of NLA sample lakes classified by anthropogenic disturbance stress as least-disturbed, intermediate, and most-disturbed, based on region-specific low- and high-disturbance screens. Parentheses show subtotals for the Central Plains and Western US regions formed by combining 2 or more of the 9 NLA aggregated ecoregions.
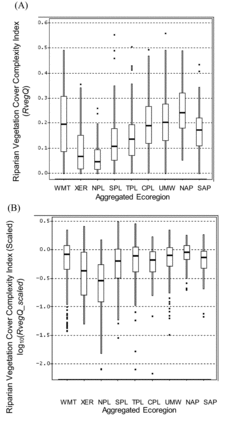
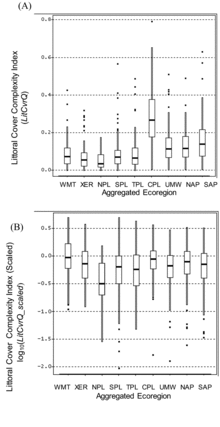
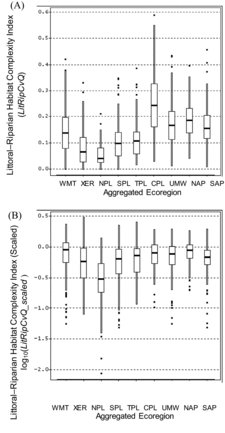
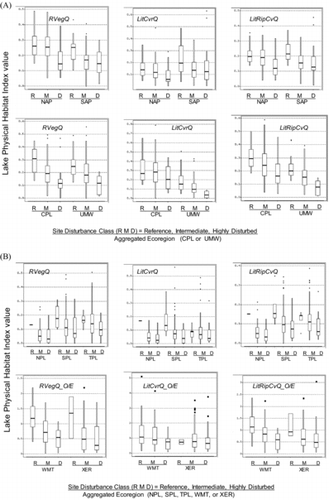
Table 3 Assignment of Riparian Vegetation Cover Complexity, Littoral Cover Complexity, and Littoral–Riparian Habitat Complexity index variants by aggregated ecoregion () and multivariate lake type (; ).
Table 4 Multiple linear regression models used for calculating expectations for indices of Riparian Vegetation Cover Complexity, Littoral Cover Complexity, and Littoral–Riparian Habitat Complexity for lakes in the Western Mountain and Xeric aggregated ecoregions. Highly disturbed lakes were excluded from calculations.
Table 5 Mean and standard deviation of habitat index values in regional sets of least-disturbed reference lakes in the aggregated ecoregions of the NLA. Geometric mean and standard deviation are antilogs of mean and SD of log10-transformed index values (LogMean and LogSD). Parentheses enclose the minimum values (i.e., the most precise models for each index). Bold text marks the least precise models. SDs calculated from log-transformed variables are expressions of the proportional variance of these distributions and so are directly comparable among regions with different geometric means. A range of ±1SD is calculated by multiplying and dividing the geomMean by the geomSD. For example, the LogMean ± 1LogSD for the Riparian Vegetation Cover Complexity Index in least-disturbed lakes of the NAP (−0.571 ± 0.128) translates to a range of habitat index values from 0.200 to 0.359: the geometric mean habitat index value of 0.268 multiplied and divided by 1.34, the antilog of 0.128. The multiple 1.34 in this case is equivalent to a CV of 134%.
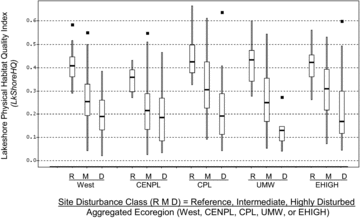
Table 6 Condition criteria for habitat index values and scaled habitat index values based on the distribution of index values in least-disturbed lakes within each region. The 5th and 25th percentiles, respectively, were set as the upper bounds for poor and fair condition, respectively. These percentiles were estimated, respectively, as the mean of log-transformed index values minus 1.65 and 0.67 times the SD of log-transformed habitat index values (see for the least-disturbed means and SDs, and see for the variant of each index used). All percentiles are expressed as antilogs of log-transformed values. For the null models, percentiles are in the units of the physical habitat indices (the O/E percentiles are not). Scaled percentiles in the last 2 columns are directly comparable between null and O/E models. Parentheses denote null model estimates that were replaced by lake-specific regression O/E model estimates in the West.
![Figure 2 Comparison of Lakeshore Anthropogenic Disturbance Index (RDis_IX) values in sample lakes across 9 NLA aggregated ecoregions. Unweighted sample statistics are shown; box midline and lower and upper ends show median and 25th and 75th percentile values, respectively; whiskers show maximum and minimum observations within 1.5 times the interquartile range above/below box ends. See Fig. 1 for definitions of aggregated ecoregions.](/cms/asset/efe58c57-f4da-43be-8336-15742bd74a60/ulrm_a_906524_f0002_b.gif)
![Figure 3 Comparison of (A) Riparian Vegetation Cover Complexity Index (RVegQ), and (B) scaled values of the same index (log10-transformed) in sample lakes across 9 NLA aggregated ecoregions (RVegQ_scaled = RVegQ divided by its geometric mean in least-disturbed lakes within the same region). Unweighted sample statistics are shown. Box midline and lower and upper ends show median and 25th and 75th percentile values, respectively; whiskers show maximum and minimum observations within 1.5 times the interquartile range above/below box ends; dots show outliers. See Fig. 1 for definitions of aggregated ecoregions.](/cms/asset/200986c3-0f03-4f49-abfa-90de76f895de/ulrm_a_906524_f0003_b.gif)
![Figure 4 Comparison of (A) Littoral Cover Complexity Index (LitCvrQ), and (B) scaled values of the same index (log10-transformed) in sample lakes across 9 NLA aggregated ecoregions (LitCvrQ_scaled = LitCvrQ divided by its geometric mean in least-disturbed lakes within the same region). Unweighted sample statistics are shown. Box midline and lower and upper ends show median and 25th and 75th percentile values, respectively; whiskers show maximum and minimum observations within 1.5 times the interquartile range above/below box ends; dots show outliers. See Fig. 1 for definitions of aggregated ecoregions.](/cms/asset/eb22369f-f515-4725-9318-fd96286ca562/ulrm_a_906524_f0004_b.gif)
![Figure 5 Comparison of (A) Littoral–Riparian Habitat Complexity Index (LitRipCvQ), and (B) scaled values of the same index (log10-transformed) in sample lakes across 9 NLA aggregated ecoregions (LitRipCvQ_scaled = LitRipCvQ divided by its geometric mean in least-disturbed lakes within the same region). Unweighted sample statistics are shown. Box midline and lower and upper ends show median and 25th and 75th percentile values, respectively; whiskers show maximum and minimum observations within 1.5 times the interquartile range above/below box ends; dots show outliers. See Fig. 1 for definitions of aggregated ecoregions.](/cms/asset/8f7ca4cc-fa90-4470-9157-da251bae5566/ulrm_a_906524_f0005_b.gif)
![Figure 6 Contrasts in physical habitat index values among least-disturbed reference (R), intermediate (M), and highly disturbed (D) lakes in aggregated ecoregions of the US. Unweighted sample statistics are shown; Box midline and lower and upper ends show median and 25th and 75th percentile values, respectively; whiskers show maximum and minimum observations within 1.5 times the interquartile range above/below box ends; dots show outliers. (A) NAP, SAP, CPL, and UMW ecoregions; (B) NPL, SPL, TPL, WMT, and XER ecoregions. See Fig. 1 for definitions of aggregated ecoregions.](/cms/asset/473077c0-584b-42d0-ade2-8a37a725aecf/ulrm_a_906524_f0006_b.gif)
![Figure 7 Contrasts in integrated Lakeshore Physical Habitat Quality Index (LkShoreHQ) values among least-disturbed reference (R), intermediate (M), and highly disturbed (D) lakes in aggregated ecoregions of the US. Unweighted sample statistics are shown. Box midline and lower and upper ends show median and 25th and 75th percentile values, respectively; whiskers show maximum and minimum observations within 1.5 times the interquartile range above/below box ends; dots show outliers. West = Western US (WMT + XER), CENPL = Central Plains (NPL + SPL + TPL), CPL = Coastal Plains, UMW = Upper Midwest, and EHIGH = Eastern US Highlands (NAP + SAP) ecoregions. See Fig. 1 for definitions of aggregated ecoregions.](/cms/asset/165bc473-6889-48a2-9910-fbe032a91cc8/ulrm_a_906524_f0007_b.gif)