1,167
Views
2
CrossRef citations to date
0
Altmetric
Original Articles

Effects of a protected slot limit on smallmouth bass size structure and angler harvest

, &

Figures & data

Figure 1 Lakes Sharpe, Oahe, and Francis Case in Central South Dakota.
Figure 2 Angler harvest distribution (5 cm size categories) of smallmouth bass from Lake Sharpe, SD, pre-regulation (top panel), during the 305–457 mm protected slot limit (middle panel) and during the relaxed slot limit of 355–457 mm (bottom panel). Harvest was compared within each time period and length categories with different letters denoting significantly different harvest.
Figure 3 Mean annual smallmouth bass (SMB) angler catch rate (smallmouth bass caught per hour per angler; upper left panel), harvest rate (smallmouth bass harvest per hour per angler; lower left panel), harvest (# smallmouth bass harvested; upper right panel), and angler effort (# angler trips; lower right panel) during the pre- and post-regulation time periods in Lakes Oahe, Sharpe, and Francis Case, SD. Error bars represent 1 standard error.
Figure 4 Size structure (PSD-P; upper panel), number of smallmouth bass (SMB) >355 mm caught in gill nets (middle panel), and condition (Wr; lower panel) during the pre- and post-regulation time periods in Lakes Oahe (hashed bar), Sharpe (open bar), and Francis Case (filled bar), SD. Error bars represent 1 standard error.
Figure 5 Mean length-at-age (mm) for smallmouth bass from Lake Sharpe, SD, from 2003 through 2010. Top panel depicts age-6, middle panel depicts age-7, and lower panel depicts age-8 smallmouth bass. Those years with different letters indicate differences (α < 0.05). Error bars represent 1 unit of standard error.

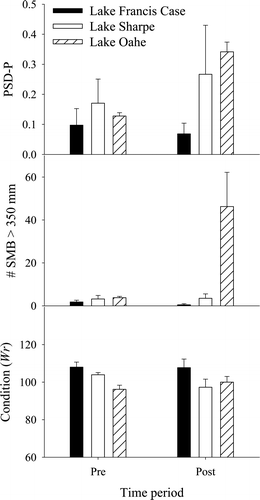
Table 1 Asymmetrical analyses of variance results comparing PSD-P, number of smallmouth bass >355 mm caught during standard surveys and smallmouth bass condition (Wr; 1998 through 2010) from Lake Sharpe, SD (protective slot limit enacted in 2003 and 2008) and 2 control reservoirs (no size restrictions; Lake Oahe and Lake Francis Case, SD). Bold type indicates a statistical significance (α = 0.10).

Figure 6 Mean length-at-age (mm) for smallmouth bass from Lake Sharpe, SD (2009). Horizontal dashed line represents 457 mm upper boundary of smallmouth bass protective slot limit.
Figure 7 Results of the responses of Lake Sharpe, SD, anglers who were asked “Are you in favor of the current smallmouth bass regulation?” from 2006 through 2011. Grey bars represent responses in favor of the regulation, and white bars represent responses not in favor of the regulation. “No opinion” responses were omitted. Data assembled from Fincel et al. (Citation2012b), Longhenry et al. (Citation2010, Citation2011), Adams et al. (Citation2009), Potter et al. (Citation2008), and Potter and Lott (Citation2007).

Reprints and Corporate Permissions

Please note: Selecting permissions does not provide access to the full text of the article, please see our help page How do I view content?

To request a reprint or corporate permissions for this article, please click on the relevant link below:

Academic Permissions

Please note: Selecting permissions does not provide access to the full text of the article, please see our help page How do I view content?

Obtain permissions instantly via Rightslink by clicking on the button below:

If you are unable to obtain permissions via Rightslink, please complete and submit this Permissions form. For more information, please visit our Permissions help page.