807
Views
18
CrossRef citations to date
0
Altmetric
Original Articles

Implications of climate change for water management of an arid inland lake in Northwest China

, , &

Figures & data

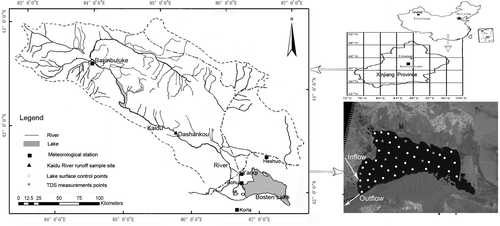
Figure 1 Sketch map of the study area (the photo is a Landsat TM5 image).

Table 1 Mann-Kendall (MK) trend tests of annual water surface evaporation capacity, water surface area and actual evaporation loss in Bosten Lake, and annual temperature and precipitation in Bosten Lake Basin from 1980 to 2011.
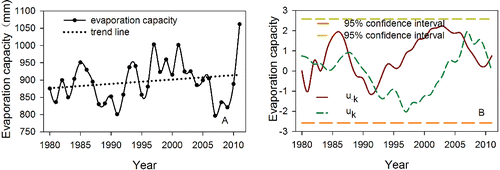
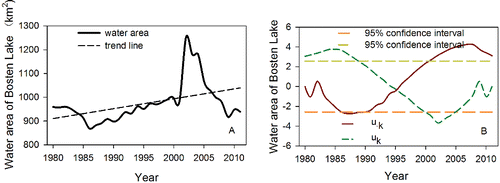
Figure 2 Annual evaporation capacity of Bosten Lake from 1980 to 2011: (A) temporal trend and (B) Mann-Kendall–Sneyers test (P > 0.05).
Figure 3 Water surface area of Bosten Lake from 1980 to 2011: (A) temporal trend and (B) Mann-Kendall–Sneyers test (P < 0.05).
Figure 4 Annual actual evaporation loss of Bosten Lake from 1980 to 2011: (A) temporal trend and (B) Mann-Kendall–Sneyers test (P < 0.05).
Figure 5 (A) Temporal trends in the TDS of Bosten Lake water from 1958-2011 and (B) regression analyses of TDS and both water surface area and actual evaporation loss of Bosten Lake from 1980 to 2011 (P < 0.05).
Figure 6 Mann-Kendall–Sneyers tests of annual temperature (A; P < 0.05) and precipitation (B; P > 0.05) in Bosten Lake Basin from 1980 to 2011.
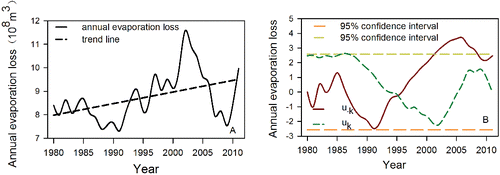
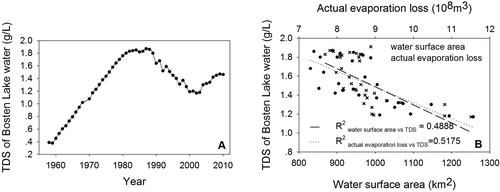
Table 2 Pearson correlation coefficients for correlations between Bosten Lake hydrologic variables and Bosten Lake Basin climatic variables.
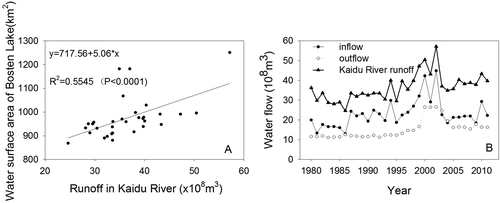
Figure 7 (A) Linear regression analysis of Kaidu River annual runoff and Bosten Lake water surface area and (B) temporal trends in net inflow and outflow of Bosten Lake and Kaidu River annual runoff from 1980 to 2011.

Table 3 Water balance of Bosten Lake in 1996.

Reprints and Corporate Permissions

Please note: Selecting permissions does not provide access to the full text of the article, please see our help page How do I view content?

To request a reprint or corporate permissions for this article, please click on the relevant link below:

Academic Permissions

Please note: Selecting permissions does not provide access to the full text of the article, please see our help page How do I view content?

Obtain permissions instantly via Rightslink by clicking on the button below:

If you are unable to obtain permissions via Rightslink, please complete and submit this Permissions form. For more information, please visit our Permissions help page.