890
Views
0
CrossRef citations to date
0
Altmetric
Original Articles

Long-term trends in reservoir water quality and quantity in two major river basins of the southern Great Plains

, , &
Pages 254-279 | Received 01 Nov 2014, Accepted 29 Jun 2015, Published online: 11 Sep 2015

Figures & data

Figure 1 Brazos and Colorado river basins showing locations of reservoirs and weather stations (+). Inset indicates location of the basins within the state of Texas.

Table 1 Water-quality and storage variables analyzed in reservoirs of the Brazos River basin for monotonic trends in their monthly values using Seasonal Kendall Tau test. Shown for each variable are the specific period of record (POR) for each analysis, tau, Sen slope (change per year), and minimum, median, and maximum values. Trends found to be significant after q-value correction (q < 0.05) are highlighted in bold, italic type. NA: either data were not available or available data did not meet minimum density criteria (see text); NC: Sen slope not calculated.

Table NaN Water-quality and storage variables analyzed in reservoirs of the Brazos River basin for monotonic trends in their monthly values using Seasonal Kendall Tau test. Shown for each variable are the specific period of record (POR) for each analysis, tau, Sen slope (change per year), and minimum, median, and maximum values. Trends found to be significant after q-value correction (q < 0.05) are highlighted in bold, italic type. NA: either data were not available or available data did not meet minimum density criteria (see text); NC: Sen slope not calculated. (Continued)

Table 2 Water quality and storage variables analyzed in reservoirs of the Colorado River basin for monotonic trends in their monthly values using Seasonal Kendall Tau test. Shown for each variable are the specific period of record (POR) for each analysis, tau, Sen slope (change per year), and minimum, median, and maximum values. Trends found to be significant after q-value correction (q < 0.05) are highlighted in bold, italic type. NA: either data were not available or available data did not meet minimum density criteria (see text); NC: Sen slope not calculated.

Table NaN Water quality and storage variables analyzed in reservoirs of the Colorado River basin for monotonic trends in their monthly values using Seasonal Kendall Tau test. Shown for each variable are the specific period of record (POR) for each analysis, tau, Sen slope (change per year), and minimum, median, and maximum values. Trends found to be significant after q-value correction (q < 0.05) are highlighted in bold, italic type. NA: either data were not available or available data did not meet minimum density criteria (see text); NC: Sen slope not calculated. (Continued)

Figure 2 Scatterplots of total (ground + surface) water withdrawals by year for the Brazos River (open circles) and Colorado River (solid circles) basins. The association was significant at P < 0.05 for the Colorado and marginally significant at P < 0.1 for the Brazos (discussed in text). A regression line is superimposed on the scatterplot for the Colorado.

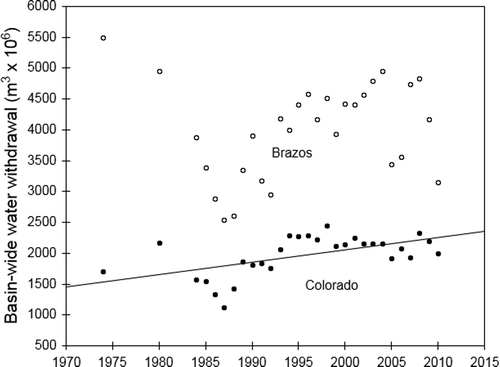
Table 3 Results of quantile regression for detection of trends in annual reservoir inflow in the Brazos and Colorado river basins. Flow rate data were obtained from USGS gages on major streams upstream of reservoirs for the period of record (POR), which varied by gage. Distributions of daily average flow rates were constructed for each year of the POR, and annual changes (10−6 m3/s per year) in the 10th, 50th, and 90th quantiles were estimated (Estimated annual change). The 10th, 50th, and 90th quantiles (10−6 m3/s) were also estimated for the entire POR (Estimated for POR), and the estimated annual changes were also expressed as a percentage of this value (Percent annual change). Trends found to be significant after q-value correction (q < 0.05) are highlighted in bold type.

Table 4 Results of quantile regression for detection of trends in annual precipitation in the Brazos and Colorado river basins. Monthly precipitation totals were calculated from daily precipitation data obtained for the period of record (POR, 1965–2009) from the National Climatic Data Center for selected weather stations. Monthly totals were grouped by year, and annual changes (monthly sum in mm/yr) in the 10th, 50th, and 90th quantiles were estimated (Estimated annual change). The 10th, 50th, and 90th quantiles (monthly sum in mm) were also estimated for the entire period of record (Estimated for POR), and the estimated annual changes were also expressed as a percentage of this value (Percent annual change). Trends found to be significant after q-value correction (q < 0.05) are highlighted in bold type.

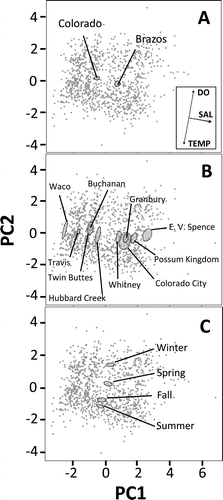
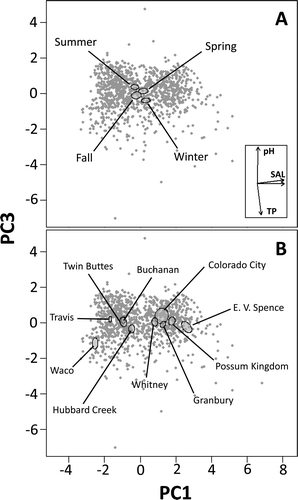
Table 5 Principal component analysis of monthly water quality data. Loading factors are shown for each variable in the first three principle components (PC) retained by the analysis. Variables with loadings ≥ |0.4| are highlighted in bold type. Eigenvalues, and proportional and cumulative variance are shown for each PC.

Figure 3 Biplots of principal components 1 and 2 from PCA of monthly water quality data for selected reservoirs in the Brazos River and Colorado River, Texas. The maximum period of record was 1965–2010. Data are grouped according to 3 different association criteria: (A) basin, (B) individual reservoir, and (C) season (winter, Dec–Feb; spring, Mar–May; summer, Jun–Aug; fall, Sep–Nov). To facilitate visual identification of patterns, 95% confidence ellipses (SE) were constructed around the respective groups. Vectors shown in inset represent variables with factor loadings >|0.4|. DO = dissolved oxygen; SAL = salinity-related variables (chloride, specific conductance, and sulfate); TEMP = temperature.
Figure 4 Biplots of principal components 1 and 3 from PCA of monthly water quality data for selected reservoirs in the Brazos River and Colorado River, Texas. The maximum period of record was 1965–2010. Data are grouped according to 2 different association criteria: (A) season (winter, Dec–Feb; spring, Mar–May; summer, Jun–Aug; fall, Sep–Nov), and (B) individual reservoir. To facilitate visual identification of patterns, 95% confidence ellipses (SE) were constructed around the respective groups. Vectors shown in inset represent variables with factor loadings >|0.4|. SAL = salinity-related variables (chloride, specific conductance, and sulfate); TP = total phosphorus; pH, standard units.

Reprints and Corporate Permissions

Please note: Selecting permissions does not provide access to the full text of the article, please see our help page How do I view content?

To request a reprint or corporate permissions for this article, please click on the relevant link below:

Academic Permissions

Please note: Selecting permissions does not provide access to the full text of the article, please see our help page How do I view content?

Obtain permissions instantly via Rightslink by clicking on the button below:

If you are unable to obtain permissions via Rightslink, please complete and submit this Permissions form. For more information, please visit our Permissions help page.