744
Views
7
CrossRef citations to date
0
Altmetric
Original Articles

Seasonal nearshore sediment resuspension and water clarity at Lake Tahoe

, , &

Figures & data

Table 1. Lake Tahoe summary information.

Figure 1. Lake Tahoe (∼39°N, 120°W) bathymetry and orientation. Meteorological data were collected at Timbercove station, and lake measurements were collected at the study site. Contours are shown at 100 m intervals.
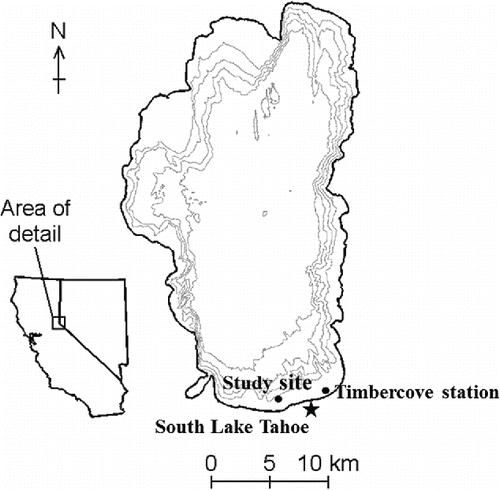
Figure 1. Lake Tahoe (∼39°N, 120°W) bathymetry and orientation. Meteorological data were collected at Timbercove station, and lake measurements were collected at the study site. Contours are shown at 100 m intervals.

Table 2. Field measurements for Lake Tahoe in summer and winter.

Figure 2. Wind statistics separated by wind direction at Timbercove station for (a) summer 2003–2013, (b) summer during the study period, (c) winter 2003–2013, and (d) winter during the study period. Bars represent percent of wind data separated by wind direction. Wind speeds (m/s) are given as mean (closed circle) and maximum (open circle).
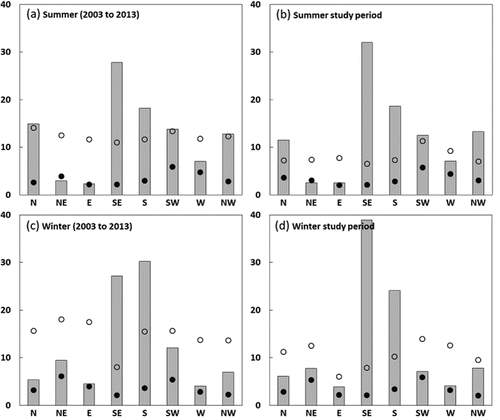
Figure 2. Wind statistics separated by wind direction at Timbercove station for (a) summer 2003–2013, (b) summer during the study period, (c) winter 2003–2013, and (d) winter during the study period. Bars represent percent of wind data separated by wind direction. Wind speeds (m/s) are given as mean (closed circle) and maximum (open circle).

Figure 3. Water temperature observed from (a) 23 July to 29 August 2008 (summer) and (b) 13 November to 20 December 2008 (winter) at the study site for top and bottom thermistors. The temperature at the top thermistor remains nearly equal to or greater than that of the bottom thermistor, implying thermodynamic neutrality or stability.
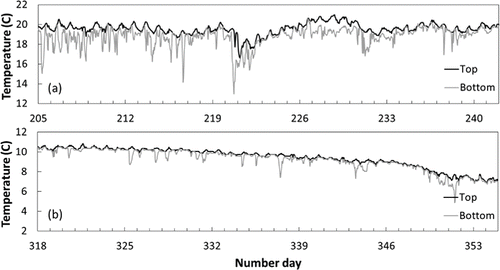
Figure 3. Water temperature observed from (a) 23 July to 29 August 2008 (summer) and (b) 13 November to 20 December 2008 (winter) at the study site for top and bottom thermistors. The temperature at the top thermistor remains nearly equal to or greater than that of the bottom thermistor, implying thermodynamic neutrality or stability.

Figure 4. Comparison of observed variables in summer from 23 July through 29 August 2008: (a) wind speed and (b) wind direction (degrees clockwise from north) measured at Timbercove station, burst-averaged nearbed current speed in the horizontal plane at (c) 0.20 m (Vector) and (d) 0.10 m (ADVOcean Probe) from the bottom, and (e) total bottom shear stress at a water depth of 5 m computed from data collected by the ADVOcean Probe. The horizontal dashed line at 0.081 Pa indicates the critical shear stress for incipient motion for a representative particle size of 150 μm.
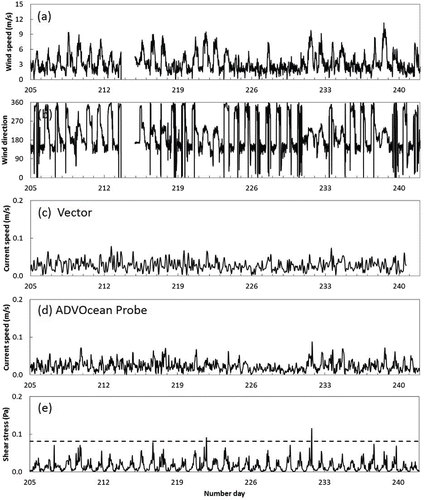
Figure 4. Comparison of observed variables in summer from 23 July through 29 August 2008: (a) wind speed and (b) wind direction (degrees clockwise from north) measured at Timbercove station, burst-averaged nearbed current speed in the horizontal plane at (c) 0.20 m (Vector) and (d) 0.10 m (ADVOcean Probe) from the bottom, and (e) total bottom shear stress at a water depth of 5 m computed from data collected by the ADVOcean Probe. The horizontal dashed line at 0.081 Pa indicates the critical shear stress for incipient motion for a representative particle size of 150 μm.
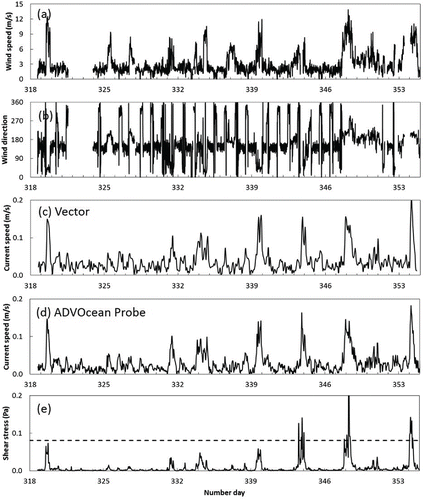
Figure 5. Comparison of observed variables in winter from 13 November to 20 December 2008: (a) wind speed and (b) wind direction (degrees clockwise from north) measured at Timbercove station, burst-averaged nearbed current speed in the horizontal plane at (c) 0.20 m (Vector) and (d) 0.10 m (ADVOcean Probe) from the bottom, and (e) total bottom shear stress at a water depth of 5 m computed from data collected by the ADVOcean Probe. The horizontal dashed line at 0.081 Pa indicates the critical shear stress for incipient motion for a representative particle size of 150 μm.

Figure 5. Comparison of observed variables in winter from 13 November to 20 December 2008: (a) wind speed and (b) wind direction (degrees clockwise from north) measured at Timbercove station, burst-averaged nearbed current speed in the horizontal plane at (c) 0.20 m (Vector) and (d) 0.10 m (ADVOcean Probe) from the bottom, and (e) total bottom shear stress at a water depth of 5 m computed from data collected by the ADVOcean Probe. The horizontal dashed line at 0.081 Pa indicates the critical shear stress for incipient motion for a representative particle size of 150 μm.

Figure 6. Power spectral density for 3-min bursts in 2008 for summer on (a) 8 August beginning at 1900 h and (b) 18 August beginning at 1700 h, and winter on (c) 9 December beginning at 0100 h, (d) 13 December beginning at 0700 h, and (e) 19 December beginning at 0900 h. The vertical dashed lines demarcate the so-called wind-wave band from 0.033 to 2 Hz (corresponding to wave periods between 0.5 and 30 s). Note that the spectra are offset for illustrative purposes.
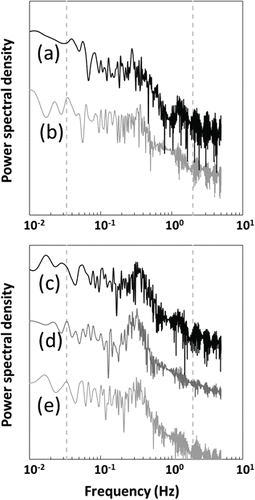
Figure 6. Power spectral density for 3-min bursts in 2008 for summer on (a) 8 August beginning at 1900 h and (b) 18 August beginning at 1700 h, and winter on (c) 9 December beginning at 0100 h, (d) 13 December beginning at 0700 h, and (e) 19 December beginning at 0900 h. The vertical dashed lines demarcate the so-called wind-wave band from 0.033 to 2 Hz (corresponding to wave periods between 0.5 and 30 s). Note that the spectra are offset for illustrative purposes.

Figure 7. Mean and maximum bottom shear stress at a water depth of 5 m separated by wind direction for (a) summer and (b) winter. The horizontal dashed line at 0.081 Pa indicates the critical shear stress for incipient motion for a representative particle size of 150 μm.
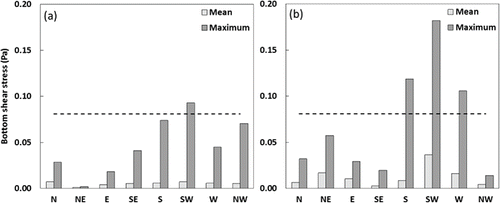
Figure 7. Mean and maximum bottom shear stress at a water depth of 5 m separated by wind direction for (a) summer and (b) winter. The horizontal dashed line at 0.081 Pa indicates the critical shear stress for incipient motion for a representative particle size of 150 μm.

Figure 8. SSC vs. total bottom shear stress at a water depth of 5 m for particles of median diameter (a) 1.25–16 μm and (b) 100–250 μm. The vertical dashed line at (a) 0.050 Pa and (b) 0.077 Pa indicates the critical shear stress for incipient motion for a particle size of 1.25 μm and 100 μm, respectively (following Parker Citation2004). The data point indicated by the open gray circle was disregarded.
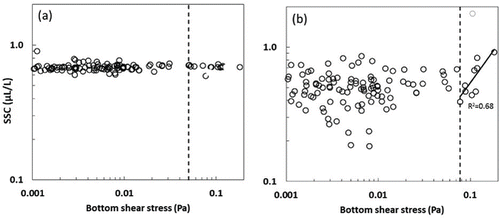
Figure 8. SSC vs. total bottom shear stress at a water depth of 5 m for particles of median diameter (a) 1.25–16 μm and (b) 100–250 μm. The vertical dashed line at (a) 0.050 Pa and (b) 0.077 Pa indicates the critical shear stress for incipient motion for a particle size of 1.25 μm and 100 μm, respectively (following Parker Citation2004). The data point indicated by the open gray circle was disregarded.

Figure 9. Particle resuspension with varying water depths and wave heights. Solid lines show the limit at which different particle diameters are resuspended from the lakebed. Similarly, the broken line shows the case for particles with diameter ≤10 μm.
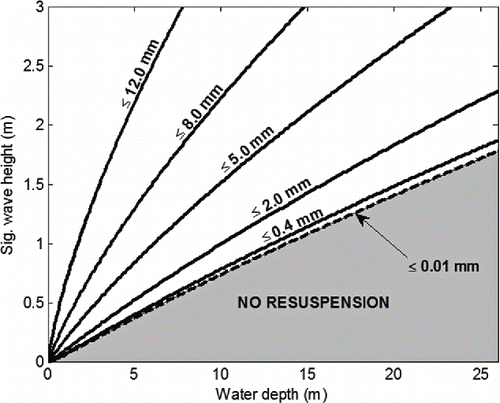
Figure 9. Particle resuspension with varying water depths and wave heights. Solid lines show the limit at which different particle diameters are resuspended from the lakebed. Similarly, the broken line shows the case for particles with diameter ≤10 μm.

Figure 10. Resuspension curves considering different wind speed and direction for water depths of (a) 2.1 m, (b) 4.2 m, and (c) 8.3 m. The corresponding fetch is indicated on the secondary axis. Solid lines show the limit at which different particle diameters are resuspended from the lakebed. Similarly, the broken lines show the limiting case for particles with diameter ≤10 μm.
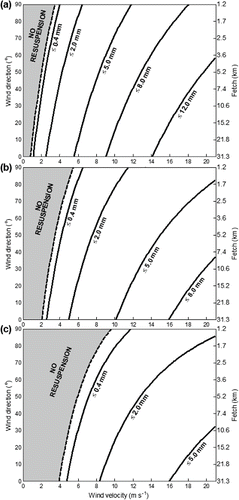
Figure 10. Resuspension curves considering different wind speed and direction for water depths of (a) 2.1 m, (b) 4.2 m, and (c) 8.3 m. The corresponding fetch is indicated on the secondary axis. Solid lines show the limit at which different particle diameters are resuspended from the lakebed. Similarly, the broken lines show the limiting case for particles with diameter ≤10 μm.

Figure 11. The areal extent of wind-driven sediment resuspension (denoted by black) in Lake Tahoe's southern nearshore zone, considering lake water level equal to (a) 2 m below the natural rim (1895 m), (b) the natural rim (1897 m), and (c) the maximum legal limit (1899 m). The area potentially affected by wind-driven sediment resuspension is (a) 4.7 km2, (b) 8.3 km2, and (c) 7.2 km2. Contours are shown at 50 m intervals. (d) Potential resuspension area with changing water surface elevation.
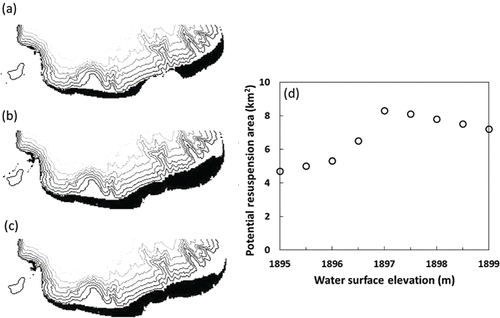
Figure 11. The areal extent of wind-driven sediment resuspension (denoted by black) in Lake Tahoe's southern nearshore zone, considering lake water level equal to (a) 2 m below the natural rim (1895 m), (b) the natural rim (1897 m), and (c) the maximum legal limit (1899 m). The area potentially affected by wind-driven sediment resuspension is (a) 4.7 km2, (b) 8.3 km2, and (c) 7.2 km2. Contours are shown at 50 m intervals. (d) Potential resuspension area with changing water surface elevation.

Reprints and Corporate Permissions

Please note: Selecting permissions does not provide access to the full text of the article, please see our help page How do I view content?

To request a reprint or corporate permissions for this article, please click on the relevant link below:

Academic Permissions

Please note: Selecting permissions does not provide access to the full text of the article, please see our help page How do I view content?

Obtain permissions instantly via Rightslink by clicking on the button below:

If you are unable to obtain permissions via Rightslink, please complete and submit this Permissions form. For more information, please visit our Permissions help page.