1,601
Views
18
CrossRef citations to date
0
Altmetric
Original Articles

Algal blooms, circulators, waterfowl, and eutrophic Greenfield Lake, North Carolina

, , &

Figures & data

Figure 1. Greenfield Lake, Wilmington, NC, showing water sampling stations, major tributaries, the road circling the lake, and locations of Solarbee mixers.

Figure 1. Greenfield Lake, Wilmington, NC, showing water sampling stations, major tributaries, the road circling the lake, and locations of Solarbee mixers.

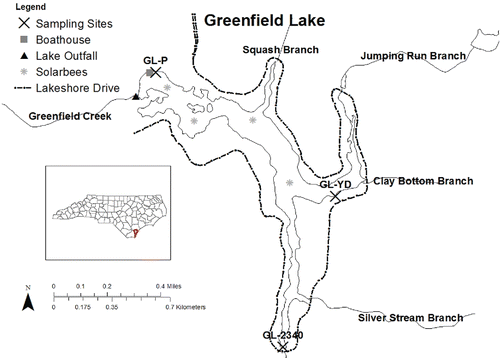
Table 1. Nutrient input factors used for various waterfowl taxon or functional groups, provided as g/dry wt of TN or TP excreted per day in feces for the individual taxon or taxa group.

Table 2. Selected water quality parameters in Greenfield Lake before (Jan 2000–Jan 2005) and after (Mar 2005–Dec 2013) lake rehabilitation measures in 2005, by individual station and all data combined. Presented as mean ± standard deviation/range.

Figure 2. Water quality parameter concentrations in Greenfield Lake, 2006–2013, presented by sampling station as means ±1 standard error of the mean (n = 50 samples). Letters above the bars designate and rank significant (P < 0.05) differences among stations. Panel a = dissolved oxygen, panel b = nitrate, panel c = orthophosphate, panel d = DIN/DIP ratio, panel e = chlorophyll a, panel f = fecal coliform bacteria.

Figure 2. Water quality parameter concentrations in Greenfield Lake, 2006–2013, presented by sampling station as means ±1 standard error of the mean (n = 50 samples). Letters above the bars designate and rank significant (P < 0.05) differences among stations. Panel a = dissolved oxygen, panel b = nitrate, panel c = orthophosphate, panel d = DIN/DIP ratio, panel e = chlorophyll a, panel f = fecal coliform bacteria.

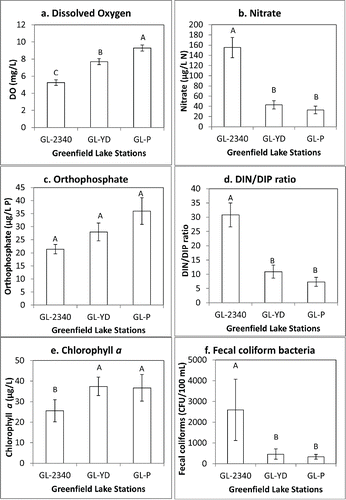
Table 3. Monthly average total waterfowl counts and estimated waterfowl nutrient deposition to the lake and shoreline.

Figure 3. Results of nutrient addition bioassay experiments from 1998 and 1999. Bars represent means of 3 replicates per treatment averaged over 3 days; *above bar represents significant (P < 0.05) difference from control. Panel a = September 1998, panel b = October 1998, panel c = April 1999, panel d = June 1999, panel e = August 1999.

Figure 3. Results of nutrient addition bioassay experiments from 1998 and 1999. Bars represent means of 3 replicates per treatment averaged over 3 days; *above bar represents significant (P < 0.05) difference from control. Panel a = September 1998, panel b = October 1998, panel c = April 1999, panel d = June 1999, panel e = August 1999.

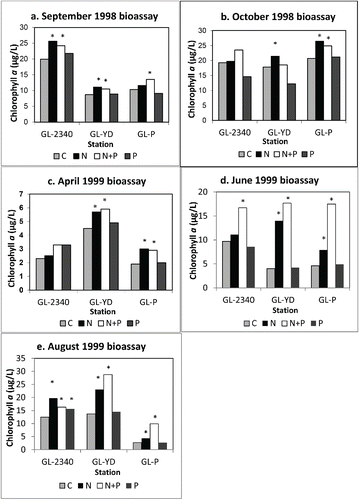
Table 4. Number and percent of dates when water samples exceeded North Carolina water quality standards before (Jan 2000–Jan 2005) and after (Mar 2005–Dec 2013) lake aeration, grass carp additions, and herbicide treatments.

Reprints and Corporate Permissions

Please note: Selecting permissions does not provide access to the full text of the article, please see our help page How do I view content?

To request a reprint or corporate permissions for this article, please click on the relevant link below:

Academic Permissions

Please note: Selecting permissions does not provide access to the full text of the article, please see our help page How do I view content?

Obtain permissions instantly via Rightslink by clicking on the button below:

If you are unable to obtain permissions via Rightslink, please complete and submit this Permissions form. For more information, please visit our Permissions help page.