Figures & data
Figure 1. Half Moon Lake, Wisconsin, showing 2011 buffered aluminum treatment areas, dosages, and sediment sampling locations.
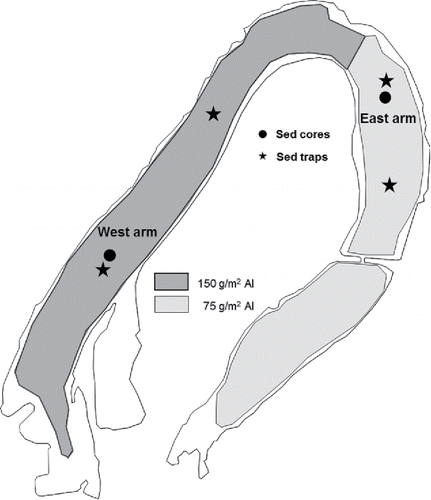
Figure 2. Vertical variations in west and east arm sediment Al in 2011 (left panels) and 2014 (right panels) versus the Al concentration in 2010, before alum application. The gray horizontal lines denote the original sediment interface before Al application. The original sediment interface was assigned a depth of zero (y-axis) with increasing negative depths below the interface. Positive depths denote the location of the deposited Al floc on top of the original sediment interface. Circles represent Al concentrations after application. Error bars for means collected in 2014 (n = 3) represent 1 standard error.
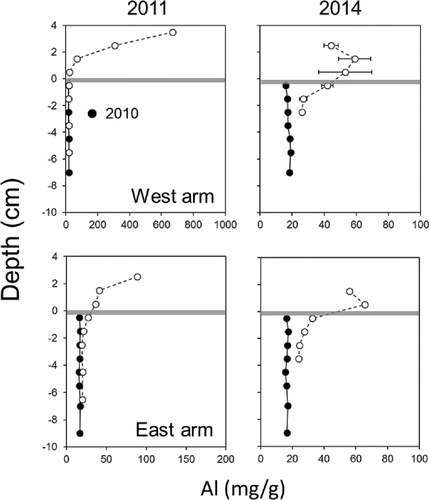
Figure 3. Vertical variations in west and east arm sediment moisture content, solids content, wet bulk density, and dry bulk density in 2010, before Al application, and in 2011, one month after Al application. The gray horizontal lines denote the location of the original sediment interface before Al application. The original sediment interface was assigned a depth of zero (y-axis) with increasing negative depths below the interface. Positive depths denote the location of the deposited Al floc on top of the original sediment interface.
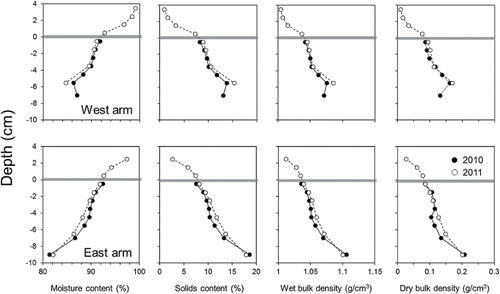
Figure 4. Vertical variations in west and east arm sediment moisture content, solids content, wet bulk density, and dry bulk density in 2010, before Al application, and in 2014, 3 years after Al application. The gray horizontal lines denote the location of the original sediment interface before Al application. The original sediment interface was assigned a depth of zero (y-axis) with increasing negative depths below the interface. Positive depths denote the location of the deposited Al floc on top of the original sediment interface. Error bars for means collected in 2014 (n = 3) represent 1 standard error.
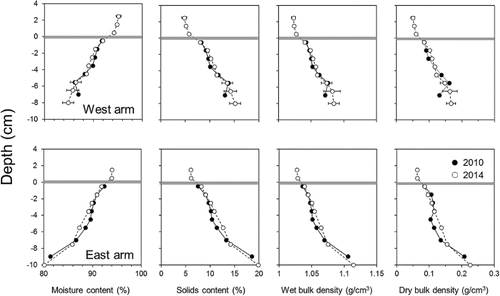
Figure 5. Annual variations in moisture content, solids content, wet bulk density, and dry bulk density in the Al floc layer of west and east arm sediments. The Al floc layer thickness was estimated as ∼3 and 2 cm in west and east arm sediments, respectively, based on vertical profile Al and physical characteristics (Figs. , and ). The black column represents pretreatment conditions of the upper 2 or 3 cm surface sediment layer, and the gray columns denote post-treatment conditions in the Al floc layer.
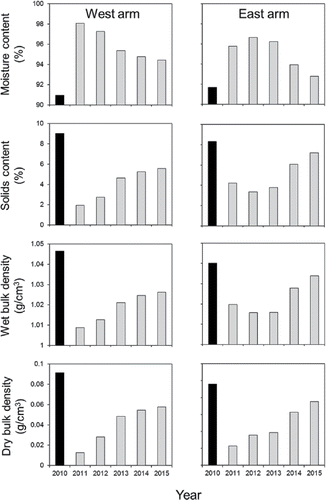
Figure 6. Vertical variations in west and east arm sediment redox-sensitive P (redox-P) and Al-bound P in 2010, before Al application, and in 2011, 1 month after Al application. The gray horizontal lines denote the location of the original sediment interface before Al application. The original sediment interface was assigned a depth of zero (y-axis) with increasing negative depths below the interface. Positive depths denote the location of the deposited Al floc on top of the original sediment interface.
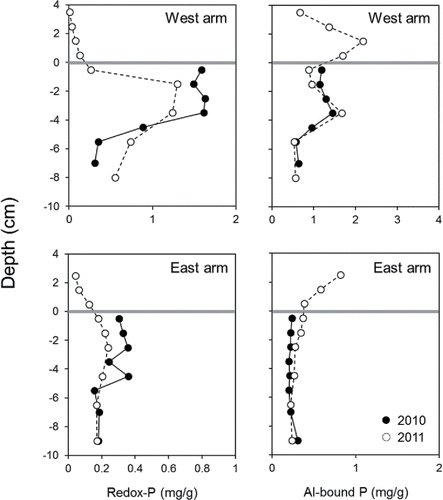
Figure 7. Vertical variations in west and east arm sediment redox-sensitive P (redox-P) and Al-bound P in 2010, before Al application, and in 2014, 3 years after Al application. The gray horizontal lines denote the location of the original sediment interface before Al application. The original sediment interface was assigned a depth of zero (y-axis) with increasing negative depths below the interface. Positive depths denote the location of the deposited Al floc on top of the original sediment interface.
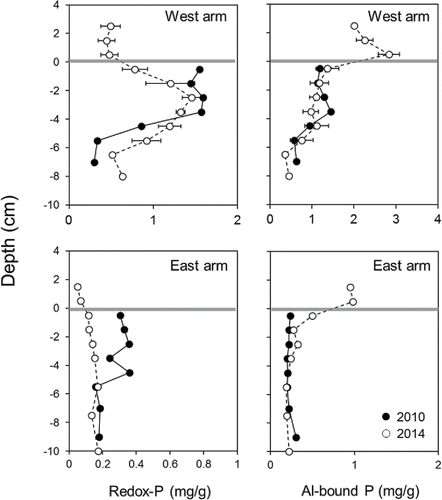
Figure 8. Annual variations in the area-weighted concentration of redox-sensitive P (redox-P), Al-bound P, and the combined P (i.e., redox-P plus Al-bound P) in the Al floc layer of west and east arm sediments.
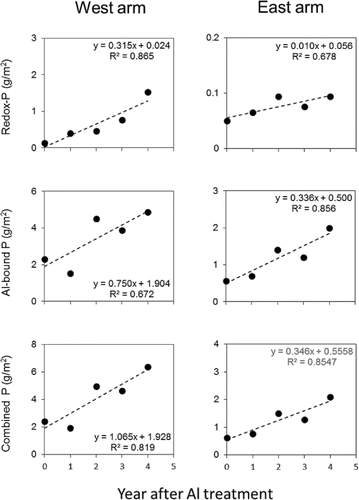
Figure 9. Annual variations in redox-sensitive P (redox-P) and Al-bound P in the Al floc layer of west and east arm sediments. The Al floc layer thickness was estimated as ∼3 and 2 cm in west and east arm sediments, respectively, based on vertical profile Al and physical characteristics (Figs. , and ). The black column represents pretreatment conditions of the upper 2 or 3 cm surface sediment layer, and the gray columns denote post-treatment conditions in the Al floc layer.
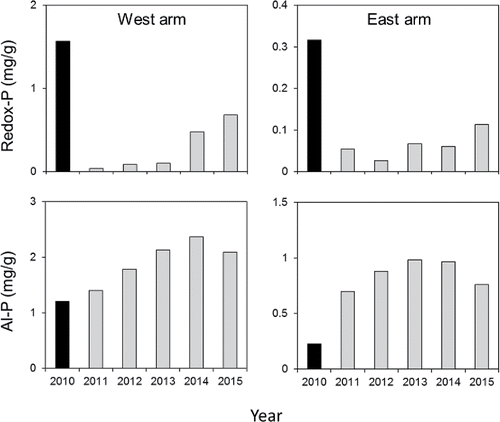
Figure 10. Estimated P binding efficiency in the Al floc layer between 2011 (1 month after Al treatment) and 2013, 2014, or 2015 for the west and east arm. P binding efficiency was calculated as the percent change in Al-bound P mass (i.e., g/m2) divided by the change in combined P mass.
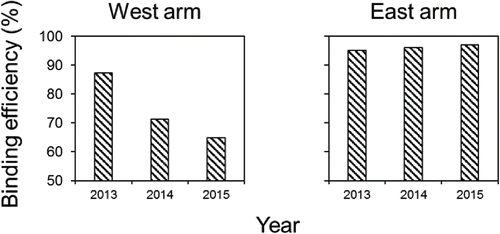
Figure 11. Annual variations in the laboratory-derived mean (n = 5, ±SE) anaerobic diffusive phosphorus (P) flux from sediments collected in the east and west arms. The black column represents pretreatment conditions, and the gray columns denote post-treatment conditions.
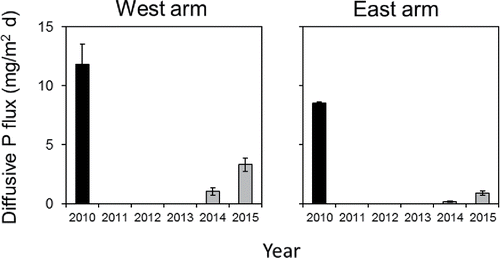
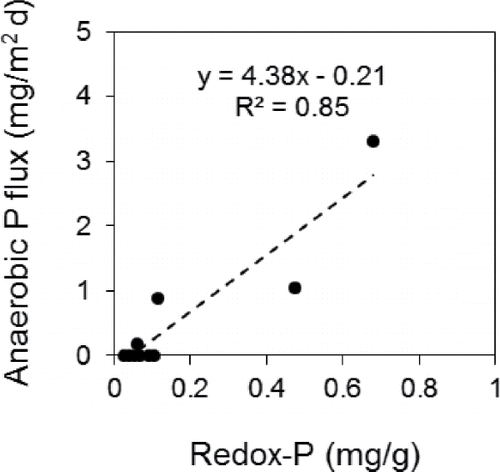
Figure 12. Post-treatment anaerobic diffusive phosphorus (P) flux versus the redox-P concentration in the Al floc layer.