Figures & data
Figure 1. The Lake of the Woods watershed shown using European Space Agency MERIS imagery from 25 Aug 2008.
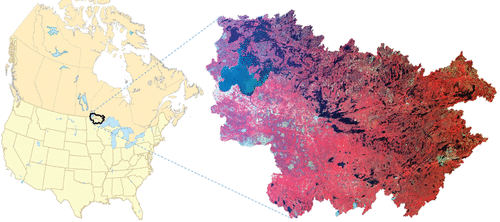
Figure 2. Multitemporal Landsat paths of images (3-band false color composite) used for land cover classification.
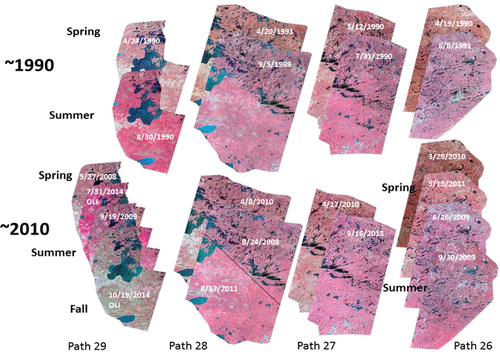
Figure 3. Flowchart of image processing and classification approach.
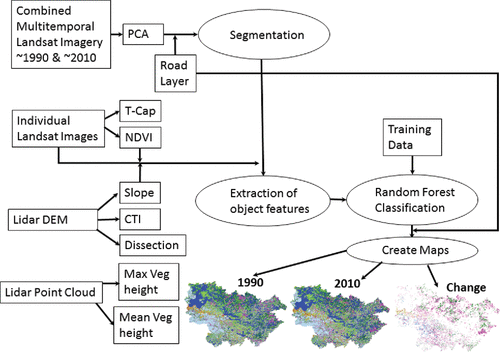
Figure 4. Principal components 1–4 and composite image of first 3 principal components of the International Falls, Minnesota, USA/Fort Frances, Ontario, Canada area.
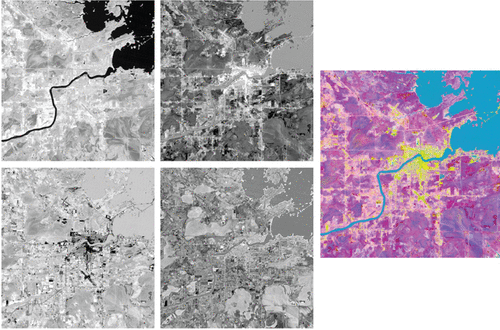
Figure 5. Lidar derived variables.
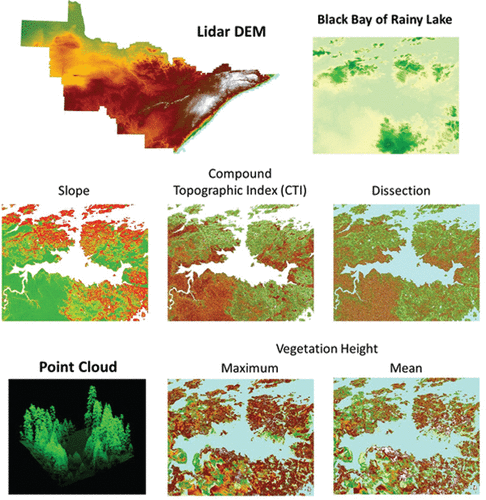
Table 1. Classification scheme with level 1 and 2 classes.
Figure 6. NAIP image with examples of cover type classes.
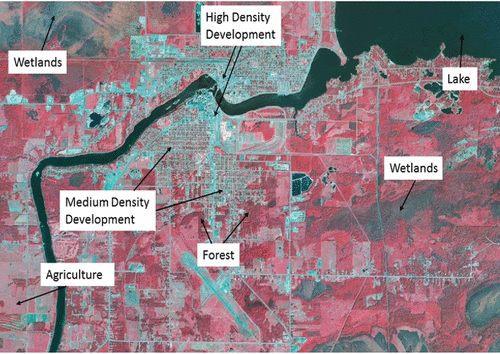
Figure 7. Segmentation objects of uplands and wetlands using principal components and major roads.
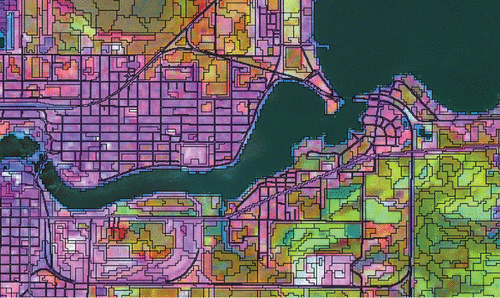
Figure 8. Objects over 2008 NAIP false color imagery for the same area as in .
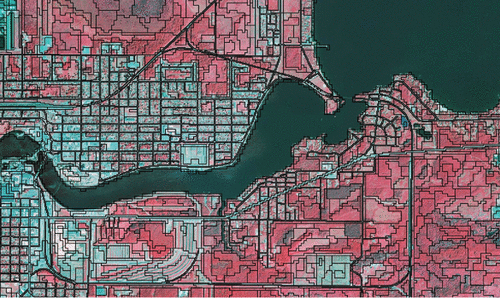
Figure 9. Lake of the Woods/Rainy River Basin level 2 land cover classification legend.
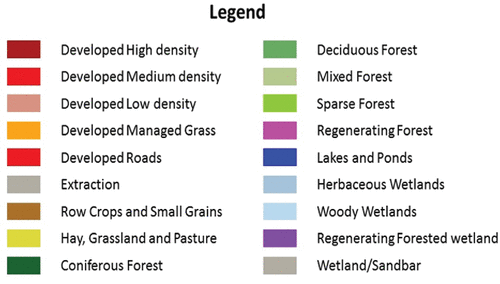
Figure 10. 1990 Lake of the Woods/Rainy River Basin level 2 land cover classification. The legend is shown in .
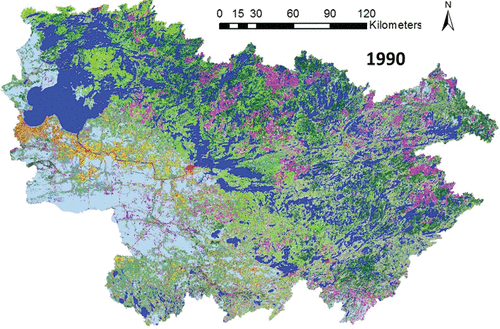
Figure 11. 2010 Lake of the Woods/Rainy River Basin level 2 land cover classification. The legend is shown in .
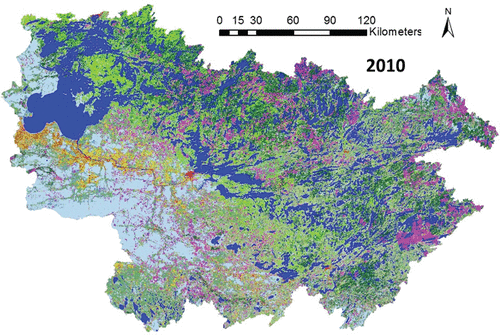
Table 2. Overall accuracies for level 1 and 2 classifications by Landsat path with and without lidar data.
Table 3. Classification error matrix and accuracies for 1990 level 1 with lidar data.
Table 4. Classification error matrix and accuracies for 1990 level 1 without lidar data.
Table 5. Classification error matrix and accuracies for 2010 level 1 with lidar data.
Table 6. Classification error matrix and accuracies for 2010 level 1 without lidar data.
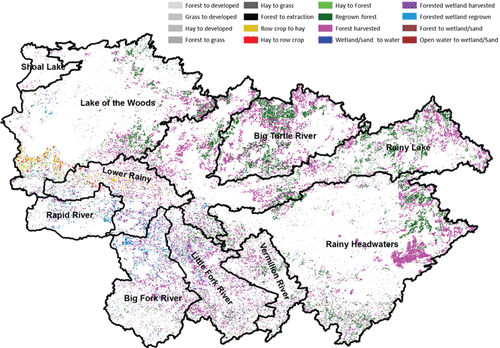
Figure 12. Land cover change from 1990 to 2010 for Lake of the Woods/Rainy River Basin the with sub-basin boundaries.