
Figures & data
Figure 1. Locations of benthic sampling sites and lake basins on Lake of the Woods from 2008 to 2014. Inset shows sites in the northern basin of the lake near Kenora, ON.
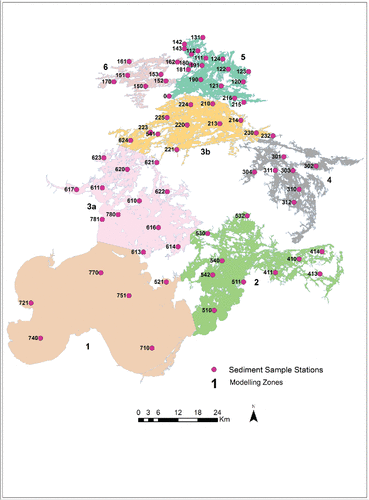
Table 1. Particle size and composition of sediment for benthic invertebrate sites on Lake of the Woods. Particle size is in microns.
Table 2. Sediment concentrations of metals, nutrients and minerals by LOW basin.
Figure 2. a. Regression of arsenic and LOI (organic matter) concentrations in sediment. b. Regression of titanium and aluminum. c. Regression of iron and aluminum concentrations. d. Regression of nickel and aluminum. e. Regression of copper and LOI. Dotted lines represent the 95% prediction limit of the regression.
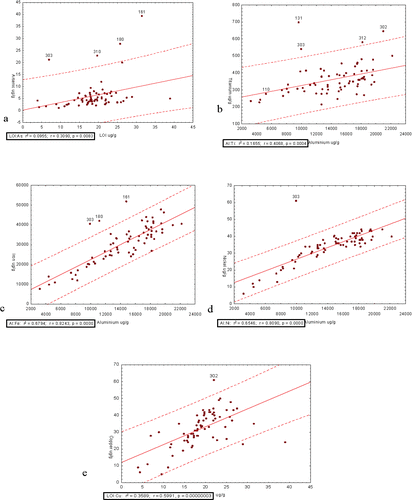
Figure 3. Average number of benthic macro invertebrates per core as classified by major taxonomic group from 5 temporally replicated sites from Lake of the Woods (n = 42) from 2008 to 2010.
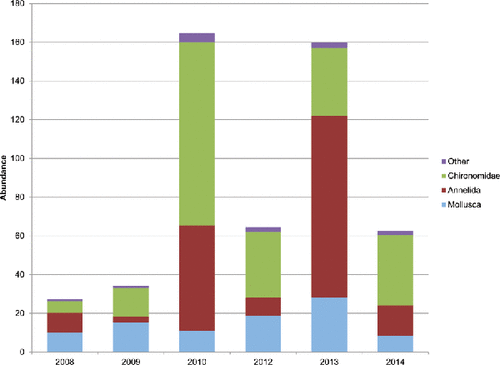
Table 3. Exceedences in Ontario and Canadian sediment quality guidelines for the protection of aquatic life at the LEL and SEL levels and the percentage of sites that exceed these guidelines. Also shown are SeQI scores based on the four sets of guidelines.
Table 4. Results of analysis of variance of benthic community indexes for site and year effects for five temporally replicated sites.
Figure 4. a. Cluster analysis of the benthic invertebrate composition of 84 reference sites. b. Multi-dimensional scaling of the benthic community of the two reference groups, with vectors indicating Pearson correlations with families greater than R = 0.4.
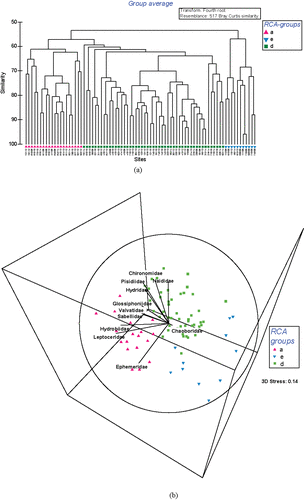
Figure 5. Factor loading for Partial Least Squares (PLS) analysis of benthic indexes number of EPT taxa and total number of taxa.
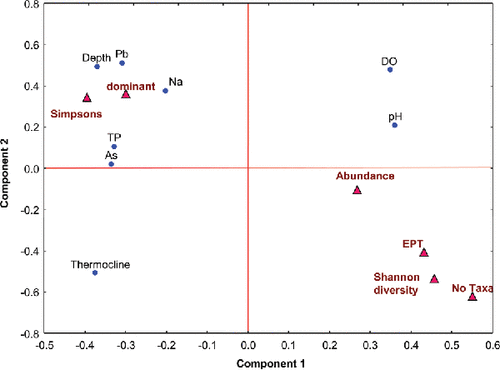
Table 5. Benthic metrics for two main reference groups and test sites, shown beside the appropriate reference group.
Table 6. Mean habitat characteristics of three reference groups, a, d and e as well as Non-Divergent (ND) test sites, Mildly Divergent (MD) test sites, Divergent (Div) test sites and Severely Divergent (SD) test sites.
