Figures & data
Figure 1. Map showing the location of the Lake of the Woods catchment within the Provinces of Ontario and Manitoba, and the State of Minnesota. The dashed oval shows the position of Lake of the Woods in the catchment, and the arrow shows the direction of its outflow into the Winnipeg River. The inset map shows the location of the 5 impact sites (circles), the reference site (square), and the Kenora airport climate station (star).
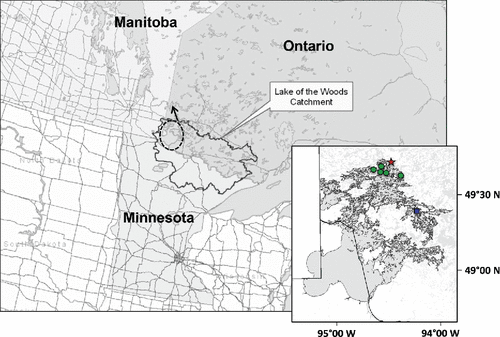
Table 1. a) Location, mixing regime (dimictic or polymictic), water column depth and year in which sediment cores were collected, spring total phosphorus (TP) concentrations, and the years averaged to determine the measured spring TP concentration for 5 impact sites and 1 reference site (in italics) in Lake of the Woods, Ontario. b) Min and max values, and 1971–2000 mean values, for mean annual temperature and total annual precipitation from the Kenora, ON climate station. Climate data are from the Historical Adjusted Climate Database for Canada, Environment Canada, for the City of Kenora, Ontario (49.78°N, 94.37°W; http://www.cccma.ec.gc.ca/hccd/).
Figure 2. Line graphs of chlorophyll a (Chl-a in mg/g dry mass) changes over time, inferred using visible range spectroscopy. Data are shown for 5 impact sites and 1 reference site (in italics) in Lake of the Woods, Ontario. The time period represented by each core is: Bigstone Bay (∼1905 – 2006); Site PP1 (∼1907 – 2006); Forrest Island (∼1908 – 2006); Poplar Bay (∼1910 – 2008); White Partridge Bay (∼1903 – 2008); and Whitefish Bay (∼1915 – 2002).
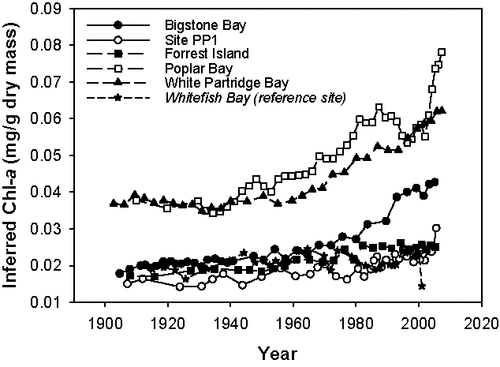
Figure 3. Line graphs of chlorophyll a (Chl-a in mg/g dry mass) changes over time, inferred using visible range spectroscopy. Data are plotted as z-scores (standardized within cores to a mean of 0 and a standard deviation of 1), and are shown for 5 impact sites (top panel) and 1 reference site (bottom panel, in italics) in Lake of the Woods, Ontario. The time period represented by each core is: Bigstone Bay (∼1905 – 2006); Site PP1 (∼1907 – 2006); Forrest Island (∼1908 – 2006); Poplar Bay (∼1910 – 2008); White Partridge Bay (∼1903 – 2008); and Whitefish Bay (∼1915 – 2002).
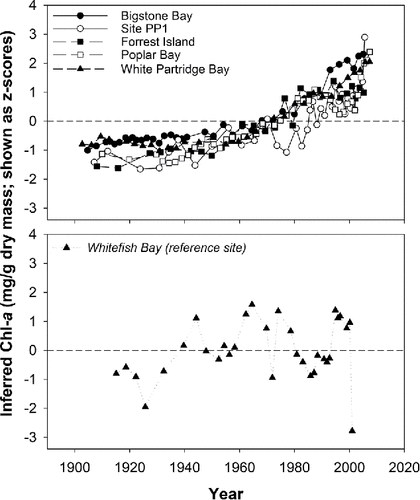
Table 2. Performance results for Pearson Product Moment correlations of spectrally-inferred chlorophyll a (Chl-a) versus diatom-inferred total phosphorus (TP) concentrations (back-transformed from log values). The following metrics are shown: the correlation coefficient (r), p-value, and the number of intervals (n) compared within each core. Bold values are significant after correction for the False Discovery Rate (following Benjamini and Hochberg Citation1995). Results are shown for 5 impact sites and 1 reference site (in italics) in Lake of the Woods, Ontario.
Figure 4. Comparative line plots showing the relationship between spectrally-inferred chlorophyll a (Chl-a, solid points) and diatom-inferred total phosphorus (TP) concentrations (open points, back-transformed from log values) for 5 impacts sites and 1 reference site (in italics) in Lake of the Woods, Ontario. For some sites, diatom-inferred TP concentrations were not computed for every downcore sample. In those cases, the TP plots are not represented by continuous lines. Inferred Chl-a values are standardized as z-scores.
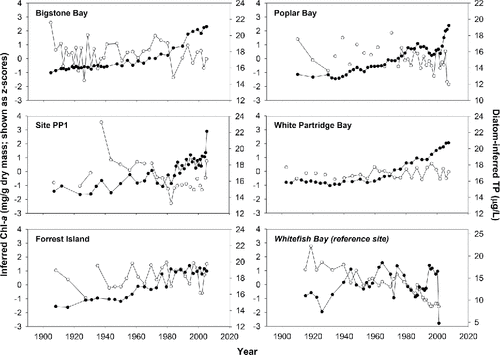
Table 3. Performance results for Pearson Product Moment correlations of spectrally-inferred chlorophyll a (Chl-a) versus mean annual temperature (MAT) and total annual precipitation at Kenora airport. The following metrics are shown: the correlation coefficient (r), p-value, and the number of intervals (n) compared within each core. Bold values are significant after correction for the False Discovery Rate (following Benjamini and Hochberg Citation1995). Results are shown for 5 impact sites and 1 reference site (in italics) in Lake of the Woods, Ontario.
Figure 5. Comparative line plots showing the relationship between spectrally-inferred chlorophyll a (Chl-a, solid points) and mean annual temperature (MAT) at Kenora airport. MAT is plotted as both annual means (light grey line), and as LOESS-smoothed values (black line), calculated from the annual mean data (smoothing factor = 0.3). Inferred Chl-a and MAT values are standardized as z-scores.
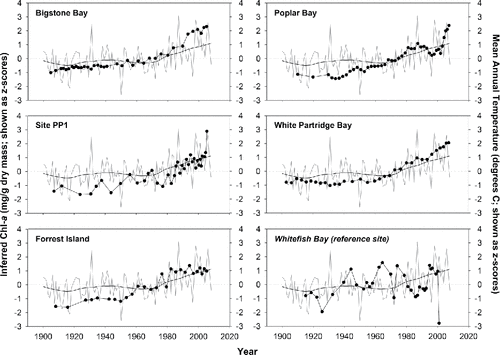
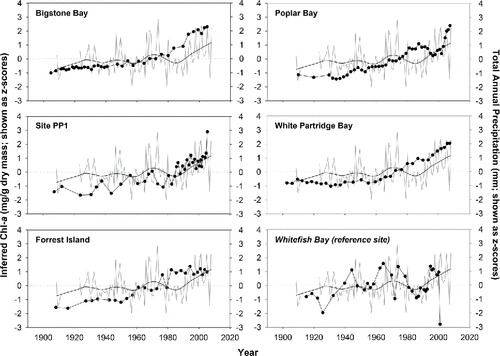
Figure 6. Comparative line plots showing the relationship between spectrally-inferred chlorophyll a (Chl-a, solid points) and total annual precipitation at Kenora airport. Precipitation is plotted as both annual means (light grey line), and as LOESS-smoothed values (black line), calculated from the annual mean data (smoothing factor = 0.3). Inferred Chl-a and precipitation values are standardized as z-scores.