420
Views
4
CrossRef citations to date
0
Altmetric
Articles

Aquatic vegetation community structure response to hydrilla management with triploid grass carp, herbicide, and native vegetation planting

&

Figures & data

Table 1. Eleven native aquatic plant species were transplanted into units with and without herbivore protection to evaluate their suitability for replacing hydrilla being controlled by triploid grass carp.

Figure 1. Vegetation cover class coverage (mean + SD) between 4 grass carp densities (C = control, LD = low density, MD = medium density, HD = high density) before (2010) and after (2011) stocking grass carp; denoted with letters are statistically similar groupings (α = 0.1) of main effects year (upper-case) and grass carp density (lower-case), where appropriate (least significant difference).

Figure 1. Vegetation cover class coverage (mean + SD) between 4 grass carp densities (C = control, LD = low density, MD = medium density, HD = high density) before (2010) and after (2011) stocking grass carp; denoted with letters are statistically similar groupings (α = 0.1) of main effects year (upper-case) and grass carp density (lower-case), where appropriate (least significant difference).

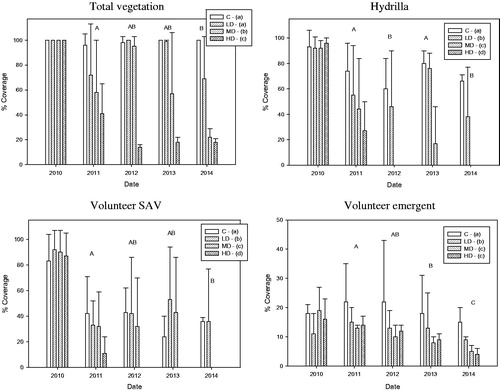
Table 2. Results of the probit regression for vegetation community structure class percent coverage response to grass carp densities over time; significance is given in bold.

Table 3. Results of the probit regression for planted vegetation cover class percent coverage response to grass carp densities over time; significance in bold.

Table 4. Raw and percent planted vegetation coverage (mean ± SD) between 4 grass carp densities (C = control, LD = low density, MD = medium density, HD = high density).

Figure 2. Hydrilla and native vegetation mean percent dominance ± SD between grass carp treatments 2011–2014; bare area not pictured.

Figure 2. Hydrilla and native vegetation mean percent dominance ± SD between grass carp treatments 2011–2014; bare area not pictured.

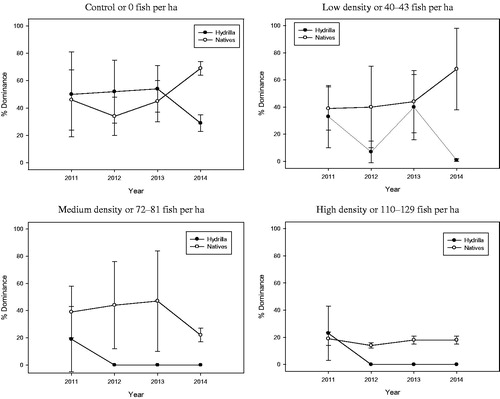
Table 5. Results of the probit regression for hydrilla and native vegetation dominance percent coverage response to grass carp densities over time; significance in bold.

Reprints and Corporate Permissions

Please note: Selecting permissions does not provide access to the full text of the article, please see our help page How do I view content?

To request a reprint or corporate permissions for this article, please click on the relevant link below:

Academic Permissions

Please note: Selecting permissions does not provide access to the full text of the article, please see our help page How do I view content?

Obtain permissions instantly via Rightslink by clicking on the button below:

If you are unable to obtain permissions via Rightslink, please complete and submit this Permissions form. For more information, please visit our Permissions help page.